Multifamily Housing
4503 Coldwater Canyon Avenue Los Angeles, CA 91604
4503 Coldwater Canyon Avenue Los Angeles, CA 91604
Details & Description
Property Highlights
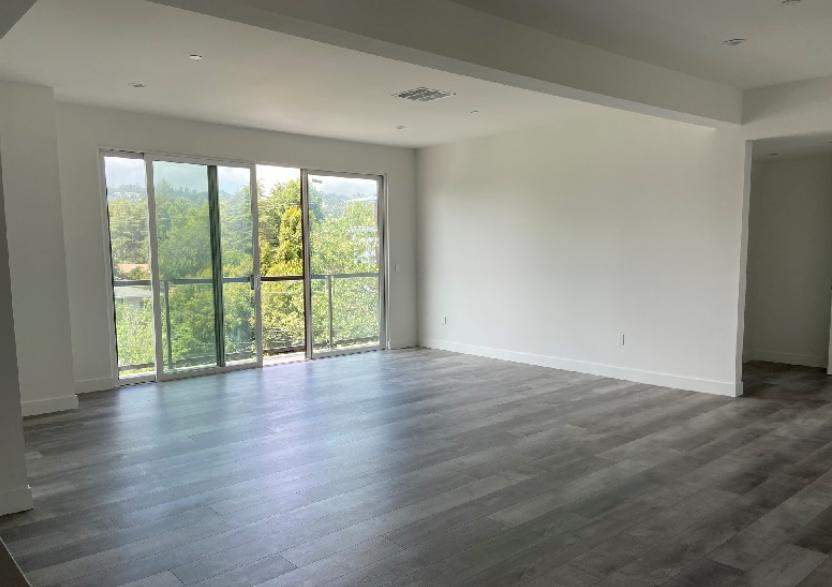
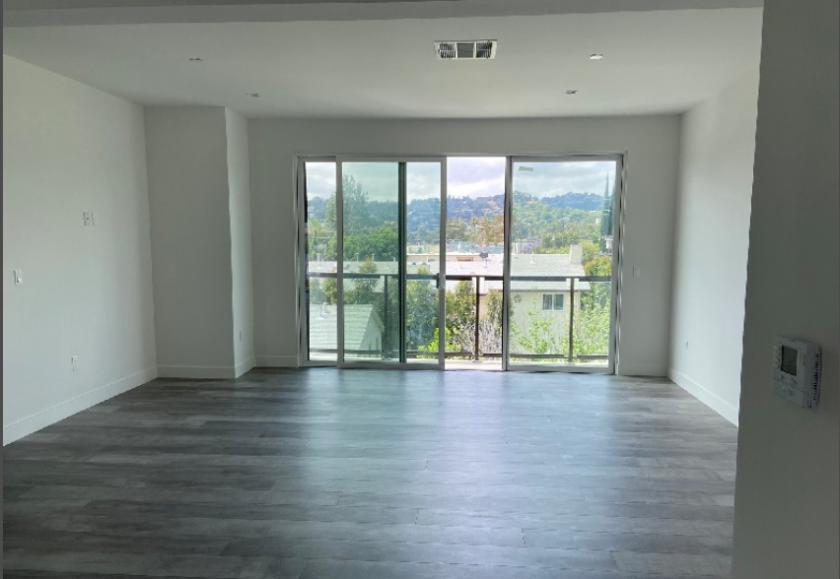
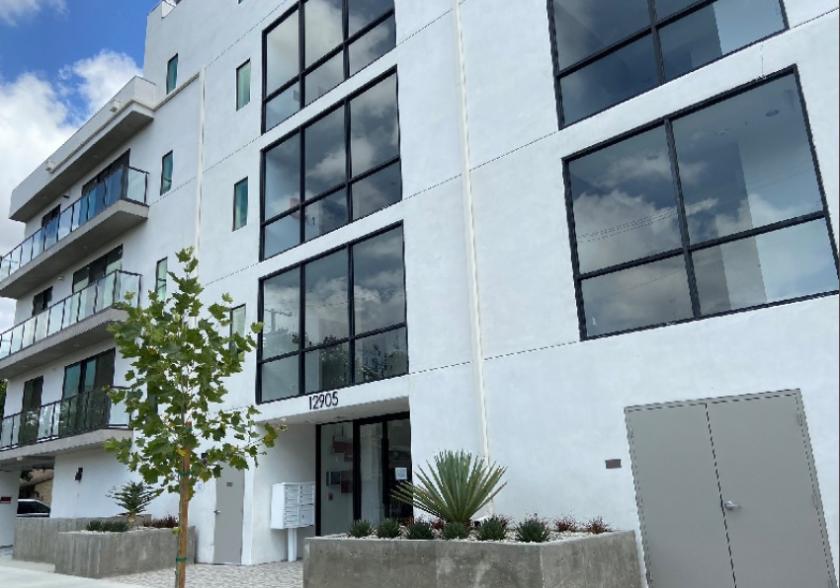
• Brand new 10 units luxury apartment building
• Brand new 10 units luxury apartment building
Listing Agents

Michael Vara
O: 213-632-7717
mvara@naicapital.com
O: 213-632-7717
mvara@naicapital.com
While we strive to provide the most accurate information, all listing information, and demographic data, is provided by third-parties. As such, MyEListing will not be responsible for the accuracy of the information. It is strongly recommended that you verify all information with the listing agent, and any relevant agencies, prior to making any decisions.