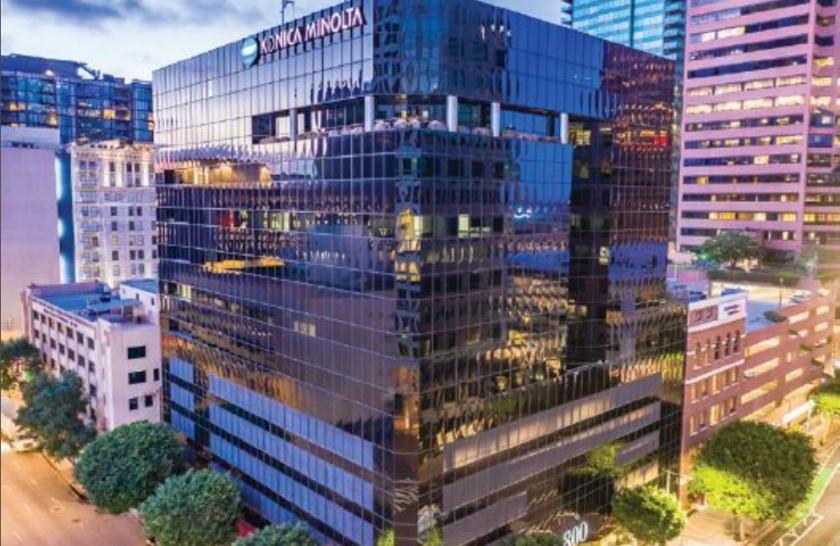
Office Space
800 South Figueroa Street Los Angeles, CA 90017
800 South Figueroa Street Los Angeles, CA 90017
Details & Description
Property Highlights
- • Fogo De Chao on the ground floor
- • Updated elevators
- • Efficient floor plans
- • Plenty of parking available
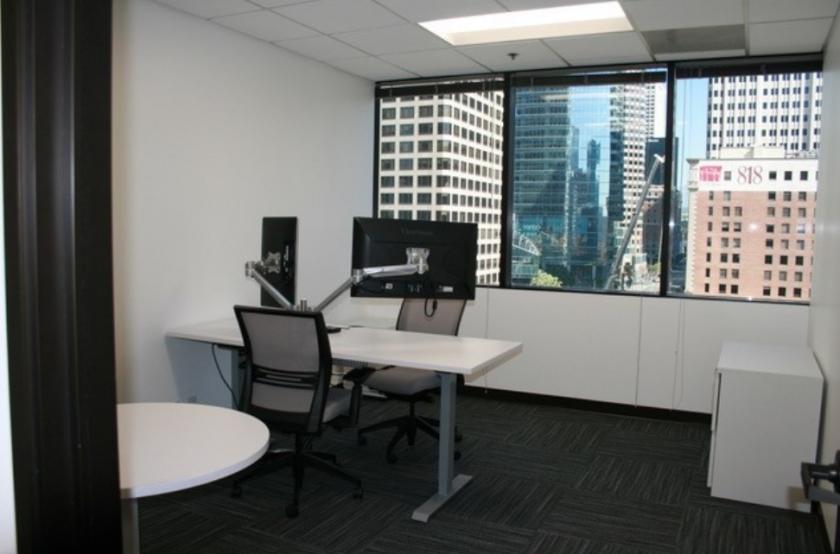
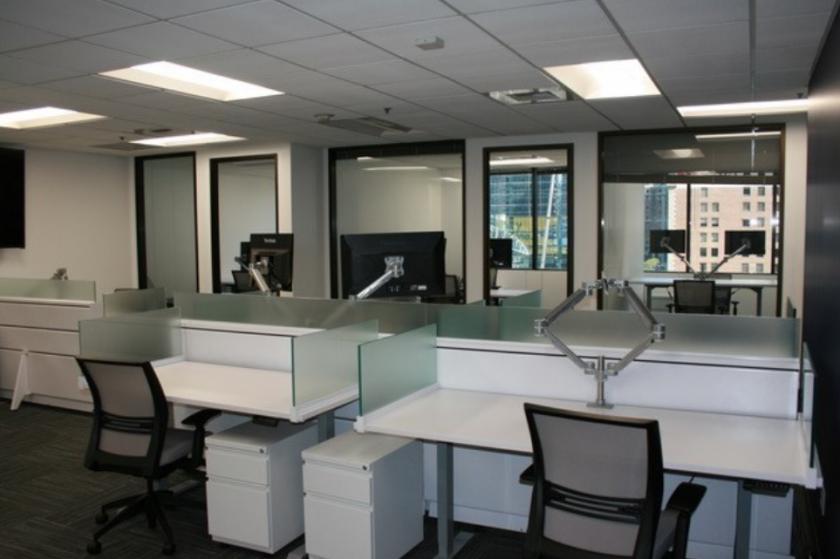
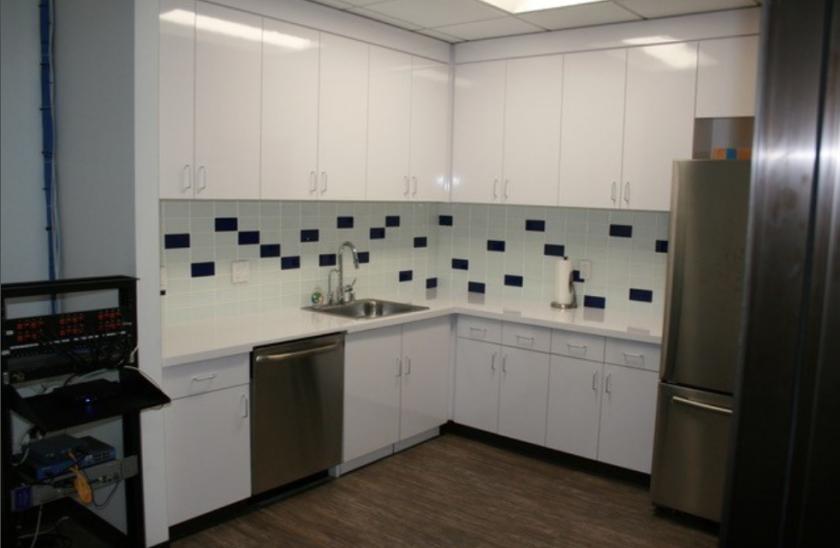
Additional Photos
Listing Agents

Mark O'Brien
O: 213-632-7712
M: 213-399-8522
mobrien@naicapital.com
O: 213-632-7712
M: 213-399-8522
mobrien@naicapital.com

Matt Renshaw
NAI Capital
O: 323-632-7720
M: 310-503-3099
mrenshaw@naicapital.com
NAI Capital
O: 323-632-7720
M: 310-503-3099
mrenshaw@naicapital.com
While we strive to provide the most accurate information, all listing information, and demographic data, is provided by third-parties. As such, MyEListing will not be responsible for the accuracy of the information. It is strongly recommended that you verify all information with the listing agent, and any relevant agencies, prior to making any decisions.


