Office Space
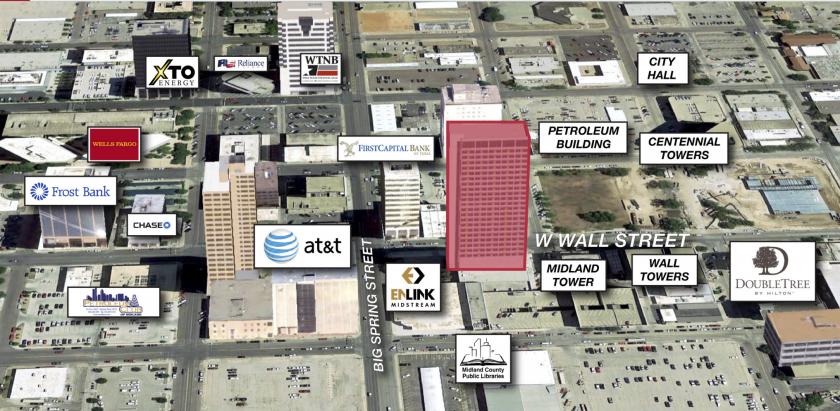
303 West Wall Street Midland, TX 79701
303 West Wall Street Midland, TX 79701
Details & Description
Property Highlights
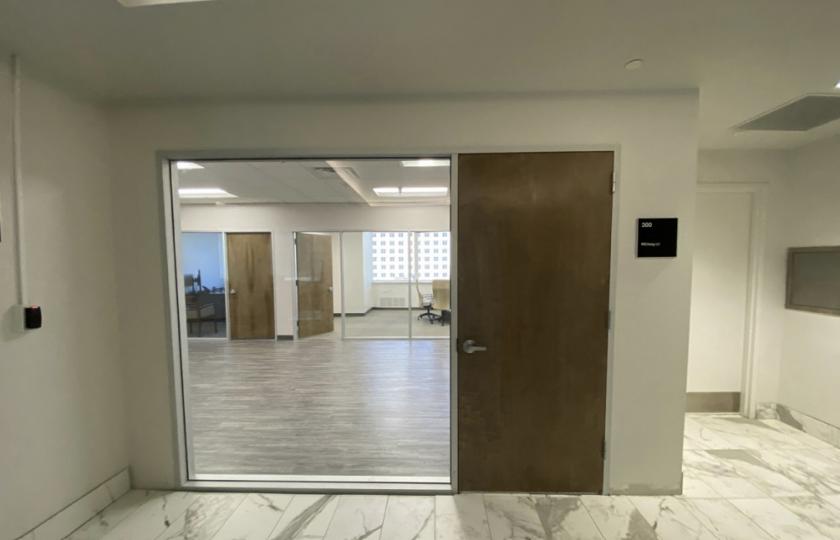
- • 7 fully built-out Executive Offices
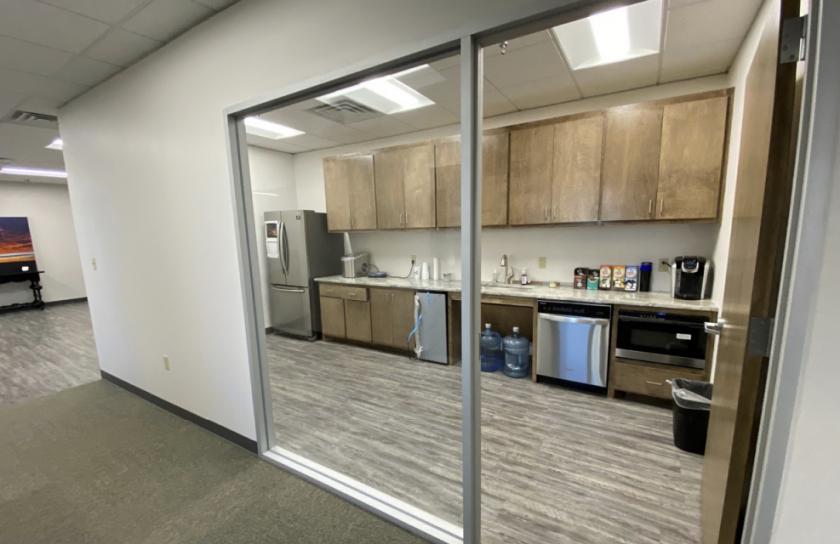
- • On-site Kitchen
- • 2 Conference Rooms
- • Garage Parking Spaces $100Mo
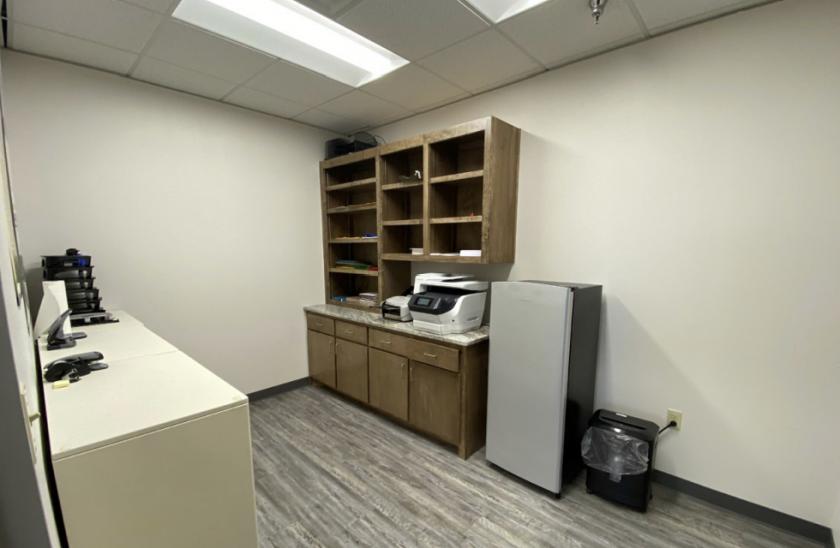
Additional Photos
Listing Agents

Joe Magby
O: 806-722-1200
M: 806-200-3244
joe@naiwheelhouse.com
O: 806-722-1200
M: 806-200-3244
joe@naiwheelhouse.com
While we strive to provide the most accurate information, all listing information, and demographic data, is provided by third-parties. As such, MyEListing will not be responsible for the accuracy of the information. It is strongly recommended that you verify all information with the listing agent, and any relevant agencies, prior to making any decisions.


