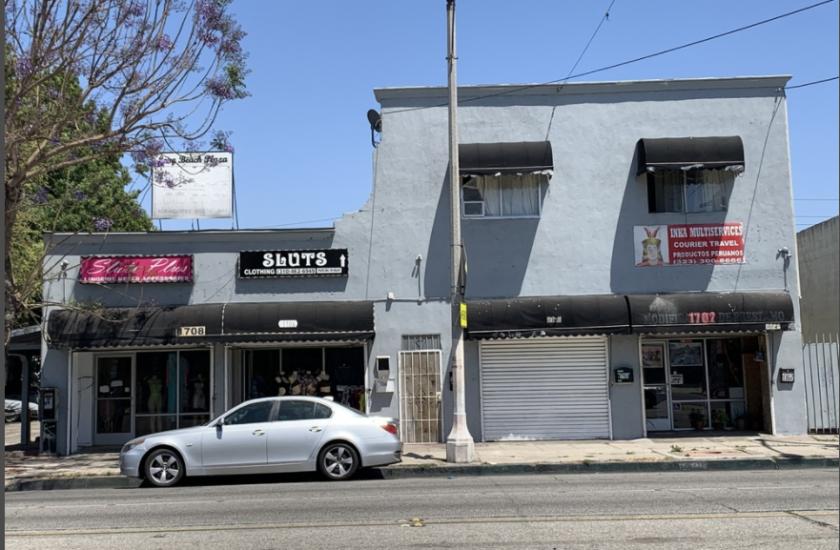
1-Mile | 3-Miles | 5-Miles | ||
---|---|---|---|---|
Total Population | 47,288 | 346,209 | 909,350 | |
Population Median Age | 33 | 33 | 34 | |
Population by Age | 0-9 Yrs | 7193 (15%) | 55787 (16%) | 137262 (15%) |
10-19 Yrs | 8263 (17%) | 56825 (16%) | 145365 (15%) | |
20-29 Yrs | 7917 (16%) | 58167 (16%) | 151453 (16%) | |
30-39 Yrs | 6966 (14%) | 49409 (14%) | 127485 (14%) | |
40-49 Yrs | 6327 (13%) | 43977 (12%) | 117918 (12%) | |
50-59 Yrs | 4940 (10%) | 37432 (10%) | 102573 (11%) | |
60-69 Yrs | 3285 (6%) | 26140 (7%) | 72607 (7%) | |
70+ Yrs | 2398 (5%) | 18473 (5%) | 54686 (6%) | |
Median HH Income | $50,429 | $52,317 | $52,854 | |
Total Household Income | < 24K | 2312 (20%) | 17664 (21%) | 51447 (21%) |
25-49K | 3185 (28%) | 21904 (26%) | 59947 (25%) | |
50-74K | 2300 (20%) | 16855 (20%) | 44962 (19%) | |
75-99K | 1567 (14%) | 11112 (13%) | 30562 (13%) | |
100-199K | 1551 (13%) | 13445 (16%) | 41163 (17%) | |
200K+ | 169 (1%) | 1634 (1%) | 6208 (2%) | |
Highest Education Level | No Diploma | 12219 | 82488 | 205622 |
Diploma or GED | 8259 | 56898 | 145117 | |
Some College | 4567 | 36769 | 105720 | |
Assoc. Degree | 1015 | 10392 | 32327 | |
Bachelors Degree | 1442 | 12931 | 46400 | |
Higher Degree | 372 | 4161 | 17150 | |
Total Housing Units | 11,387 | 85,194 | 242,642 | |
--Owner-Occupied | 4,839 | 39,841 | 104,730 | |
--Renter-Occupied | 6,243 | 42,773 | 129,559 | |
Owner-Occupied Values | < 100K | 118 | 2068 | 5971 |
100-199K | 56 | 1233 | 3439 | |
200-299K | 754 | 6222 | 12754 | |
300-399K | 1884 | 14573 | 30147 | |
400-499K | 1500 | 11361 | 29266 | |
500K+ | 529 | 4384 | 23153 | |
Total Working Age Population | 34,913 | 255,792 | 683,051 | |
In Work Force | 21,200 | 159,687 | 431,698 | |
Not In Work Force | 13,712 | 96,106 | 251,353 | |
Workforce Employed | 19,085 | 145,348 | 396,538 | |
Workforce Unemployed | 2,084 | 14,252 | 34,997 | |
Civlian Workforce | 21,168 | 159,600 | 431,535 | |
Military Workforce | 32 | 87 | 163 | |
Total Households | 11,082 | 82,614 | 234,289 | |
Family Households | 9,692 | 69,655 | 189,174 | |
Non-Family Households | 1,391 | 12,960 | 45,115 | |
Married Couple | 5,439 | 40,411 | 108,712 | |
Other Family | 4,253 | 29,243 | 80,462 | |
Married w/Child | 2,733 | 20,807 | 53,720 | |
Single Male w/Child | 659 | 3,871 | 10,330 | |
Single Female w/Child | 1,475 | 10,179 | 28,434 |
Population Change Last Two Decades - Plus Projection
2000 | % | 2010 | % | 2020 | % | 2030 | |
---|---|---|---|---|---|---|---|
California | 33,871,648 | +10 | 37,253,956 | +9 | 40,467,295 | +8 | 43,631,295 |
Los Angeles County | 9,519,338 | +3 | 9,818,605 | +6 | 10,369,367 | +4 | 10,759,850 |
Orange County | 2,846,289 | +6 | 3,010,232 | +8 | 3,257,087 | +5 | 3,431,096 |
Total Working Age Population:
Total Households:
Total Working Age Population:
Total Households:
Total Working Age Population:
Total Households: