Commercial Land
NE Corner of 19th St. W. Loop 289 Lubbock, TX 79407
NE Corner of 19th St. W. Loop 289 Lubbock, TX 79407
Details & Description
Property Highlights
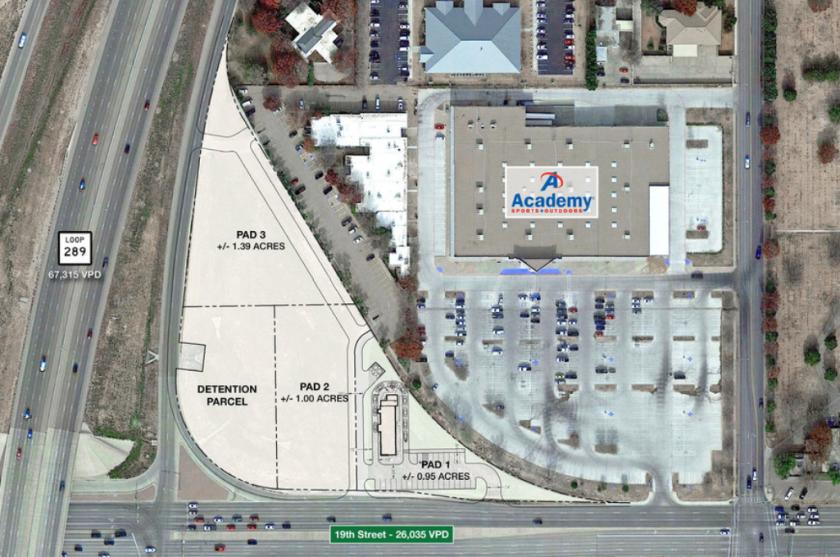
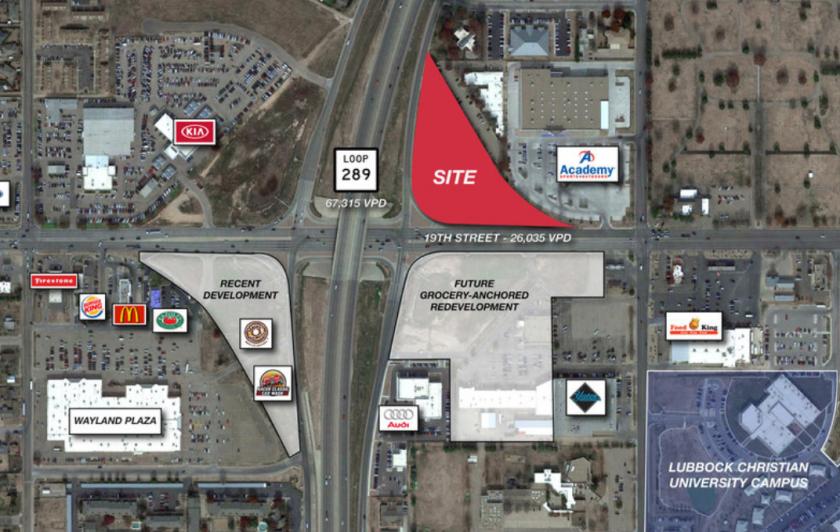
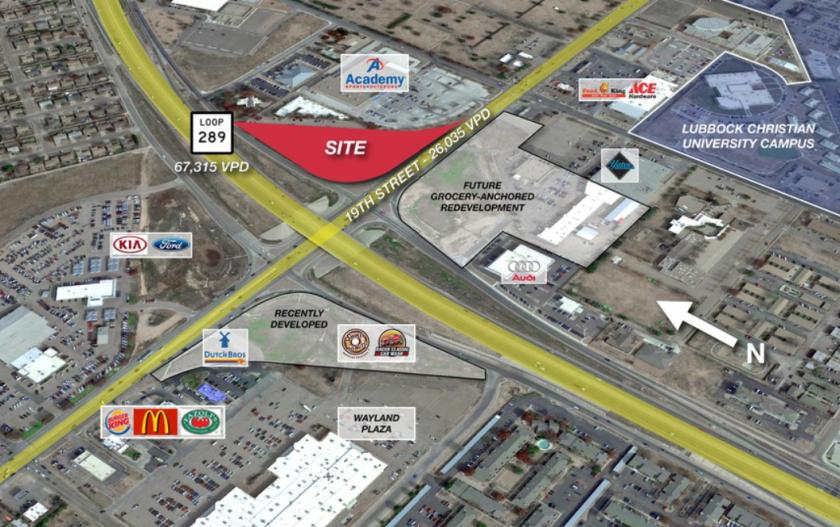
• Excellent frontage and visibility to a combined 96,981 vehicles driving past the site daily on West Loop 289 19th Stre
• 1-4 acres available on the corner of 19th Street West Loop 289 available for Ground Lease, Build-to-Suit or Purchase
Listing Agents

Kyle Cowan
O: 806-722-1204
M: 972-979-8602
kyle@naiwheelhouse.com
O: 806-722-1204
M: 972-979-8602
kyle@naiwheelhouse.com

Chase McGough
O: 806-722-1200
M: 214-674-6513
chase@naiwheelhouse.com
O: 806-722-1200
M: 214-674-6513
chase@naiwheelhouse.com
While we strive to provide the most accurate information, all listing information, and demographic data, is provided by third-parties. As such, MyEListing will not be responsible for the accuracy of the information. It is strongly recommended that you verify all information with the listing agent, and any relevant agencies, prior to making any decisions.