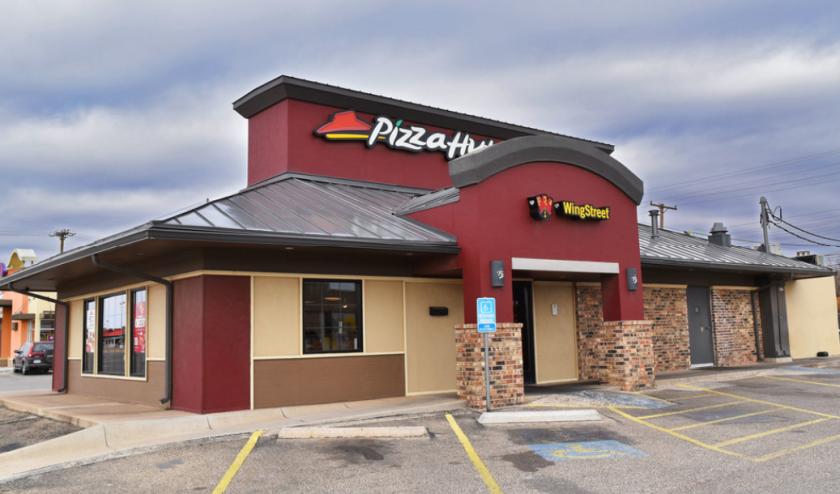
Retail Space
4926 50th Street Lubbock, TX 79414
4926 50th Street Lubbock, TX 79414
Details & Description
Property Highlights
• Boasts a population of 116,309 with an average household income of $72,170 within a 3 mile radius
• 2,065 SF Free-Standing Restaurant Site with Drive Thru Window
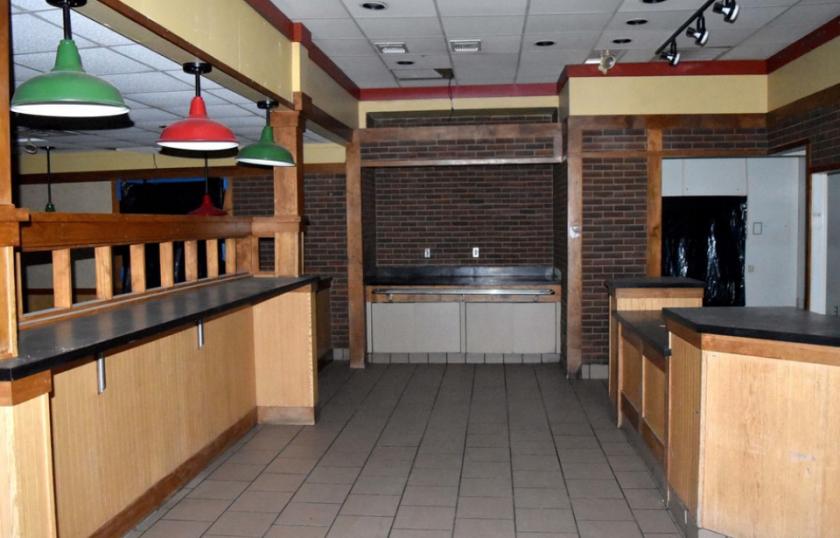
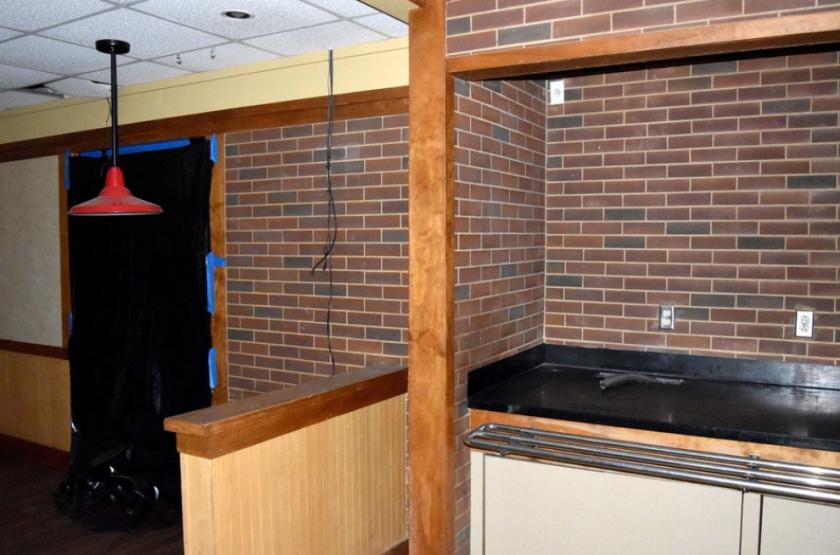
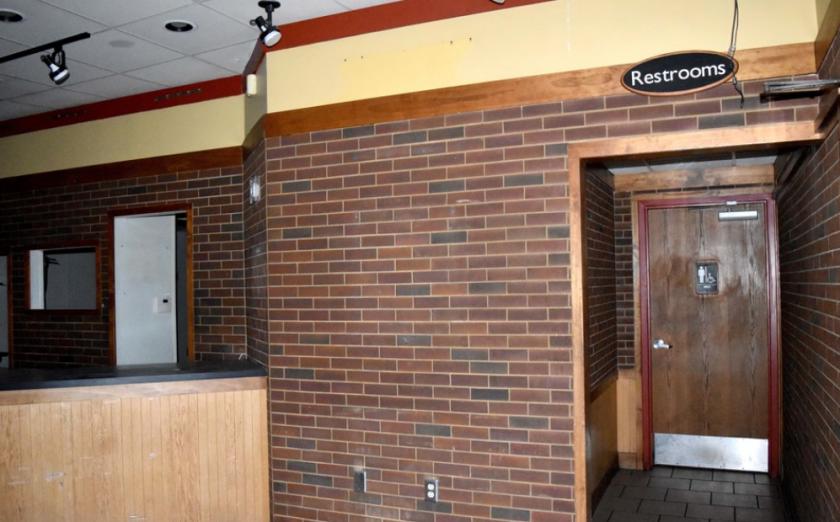
Additional Photos
Listing Agents

Kyle Cowan
O: 806-722-1204
M: 972-979-8602
kyle@naiwheelhouse.com
O: 806-722-1204
M: 972-979-8602
kyle@naiwheelhouse.com
While we strive to provide the most accurate information, all listing information, and demographic data, is provided by third-parties. As such, MyEListing will not be responsible for the accuracy of the information. It is strongly recommended that you verify all information with the listing agent, and any relevant agencies, prior to making any decisions.


