Commercial Land
114th Quaker Ave. Lubbock, TX 79424
114th Quaker Ave. Lubbock, TX 79424
Details & Description
Property Highlights
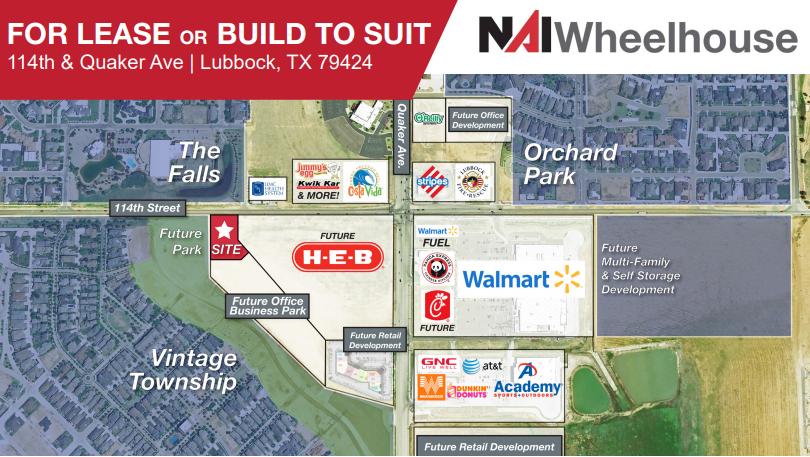
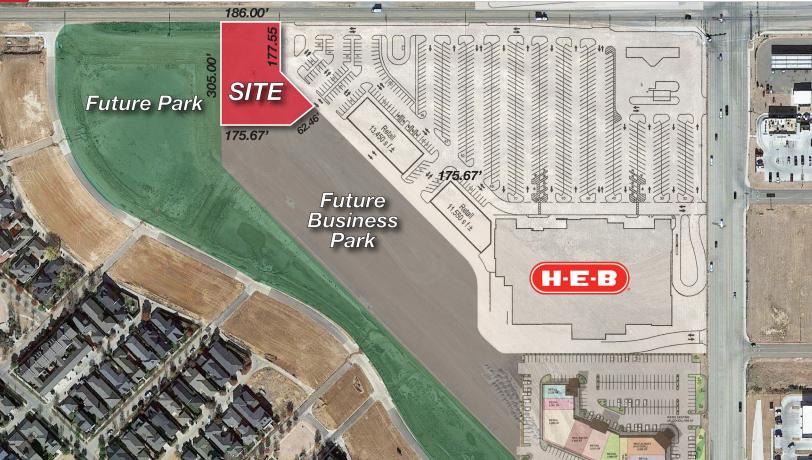
• Neighboring developments include future sites for HEB and other retailers
• 1.21 Acres located west of the 114th Quaker intersection
Listing Agents

Kyle Cowan
O: 806-722-1204
M: 972-979-8602
kyle@naiwheelhouse.com
O: 806-722-1204
M: 972-979-8602
kyle@naiwheelhouse.com
While we strive to provide the most accurate information, all listing information, and demographic data, is provided by third-parties. As such, MyEListing will not be responsible for the accuracy of the information. It is strongly recommended that you verify all information with the listing agent, and any relevant agencies, prior to making any decisions.