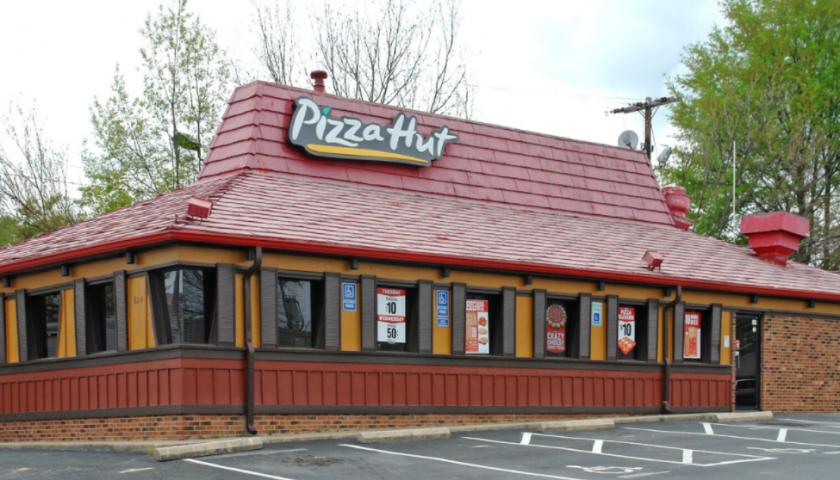
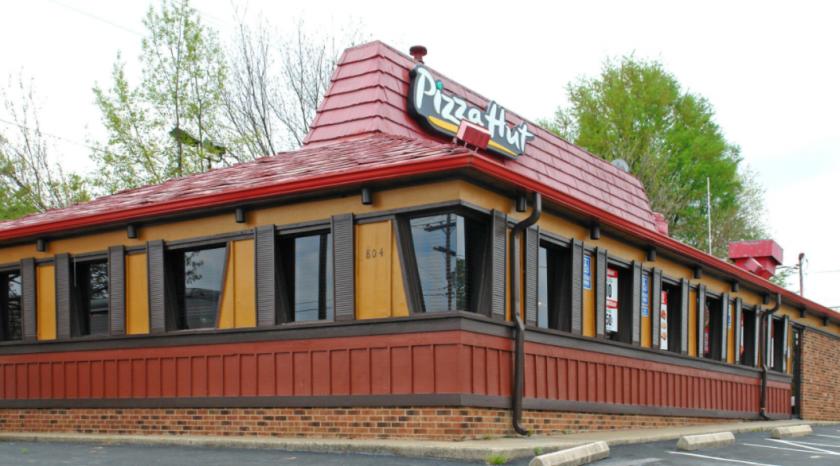
1-Mile | 3-Miles | 5-Miles | ||
---|---|---|---|---|
Total Population | 8,860 | 60,496 | 111,498 | |
Population Median Age | 36 | 37 | 38 | |
Population by Age | 0-9 Yrs | 1039 (11%) | 7942 (13%) | 13918 (12%) |
10-19 Yrs | 1788 (20%) | 9954 (16%) | 16182 (14%) | |
20-29 Yrs | 1292 (14%) | 9043 (14%) | 15798 (14%) | |
30-39 Yrs | 969 (10%) | 7025 (11%) | 13215 (11%) | |
40-49 Yrs | 961 (10%) | 6915 (11%) | 13802 (12%) | |
50-59 Yrs | 1078 (12%) | 7519 (12%) | 14774 (13%) | |
60-69 Yrs | 998 (11%) | 5990 (9%) | 11871 (10%) | |
70+ Yrs | 736 (8%) | 6107 (10%) | 11939 (10%) | |
Median HH Income | $33,742 | $35,169 | $43,875 | |
Total Household Income | < 24K | 1125 (38%) | 7544 (34%) | 11313 (26%) |
25-49K | 857 (29%) | 7171 (32%) | 12431 (29%) | |
50-74K | 334 (11%) | 3074 (13%) | 7154 (16%) | |
75-99K | 183 (6%) | 1747 (7%) | 4424 (10%) | |
100-199K | 299 (10%) | 2099 (9%) | 5606 (13%) | |
200K+ | 152 (5%) | 461 (2%) | 1304 (3%) | |
Highest Education Level | No Diploma | 1188 | 8165 | 12289 |
Diploma or GED | 1185 | 10216 | 20104 | |
Some College | 1056 | 8479 | 15929 | |
Assoc. Degree | 406 | 3018 | 6169 | |
Bachelors Degree | 943 | 5630 | 12915 | |
Higher Degree | 488 | 2323 | 6003 | |
Total Housing Units | 3,767 | 26,105 | 47,626 | |
--Owner-Occupied | 1,413 | 10,161 | 23,626 | |
--Renter-Occupied | 1,538 | 11,935 | 18,606 | |
Owner-Occupied Values | < 100K | 528 | 4201 | 6707 |
100-199K | 454 | 3966 | 10626 | |
200-299K | 230 | 1145 | 4154 | |
300-399K | 57 | 299 | 1086 | |
400-499K | 70 | 252 | 499 | |
500K+ | 74 | 298 | 553 | |
Total Working Age Population | 7,135 | 47,516 | 88,762 | |
In Work Force | 3,962 | 27,589 | 54,299 | |
Not In Work Force | 3,173 | 19,927 | 34,463 | |
Workforce Employed | 3,603 | 25,119 | 50,159 | |
Workforce Unemployed | 359 | 2,381 | 4,001 | |
Civlian Workforce | 3,962 | 27,500 | 54,160 | |
Military Workforce | 0 | 89 | 139 | |
Total Households | 2,951 | 22,096 | 42,232 | |
Family Households | 1,744 | 14,015 | 27,697 | |
Non-Family Households | 1,207 | 8,081 | 14,535 | |
Married Couple | 796 | 7,241 | 17,614 | |
Other Family | 948 | 6,774 | 10,083 | |
Married w/Child | 332 | 2,746 | 6,599 | |
Single Male w/Child | 89 | 618 | 1,075 | |
Single Female w/Child | 527 | 3,330 | 4,696 |
Population Change Last Two Decades - Plus Projection
2000 | % | 2010 | % | 2020 | % | 2030 | |
---|---|---|---|---|---|---|---|
North Carolina | 8,049,313 | +18 | 9,535,483 | +11 | 10,630,691 | +11 | 11,836,070 |
Davidson County | 147,246 | +11 | 162,878 | +5 | 170,888 | +8 | 184,987 |
Forsyth County | 306,067 | +15 | 350,670 | +9 | 383,123 | +9 | 418,257 |
Guilford County | 421,048 | +16 | 488,406 | +12 | 545,348 | +13 | 615,227 |
Randolph County | 130,454 | +9 | 141,752 | +3 | 145,807 | +6 | 154,739 |
Total Working Age Population:
Total Households:
Total Working Age Population:
Total Households:
Total Working Age Population:
Total Households: