Commercial Land
300 Highland Springs Avenue Banning, CA 92220
300 Highland Springs Avenue Banning, CA 92220
Details & Description
Property Highlights
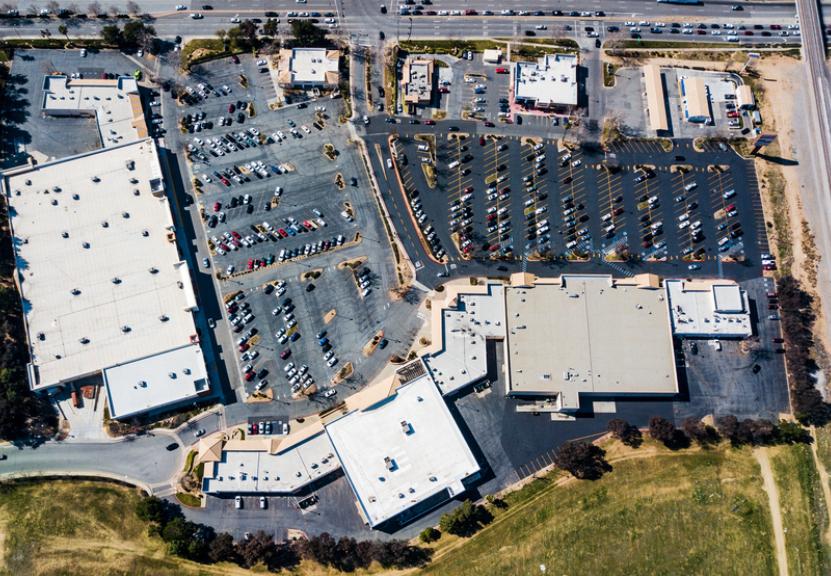
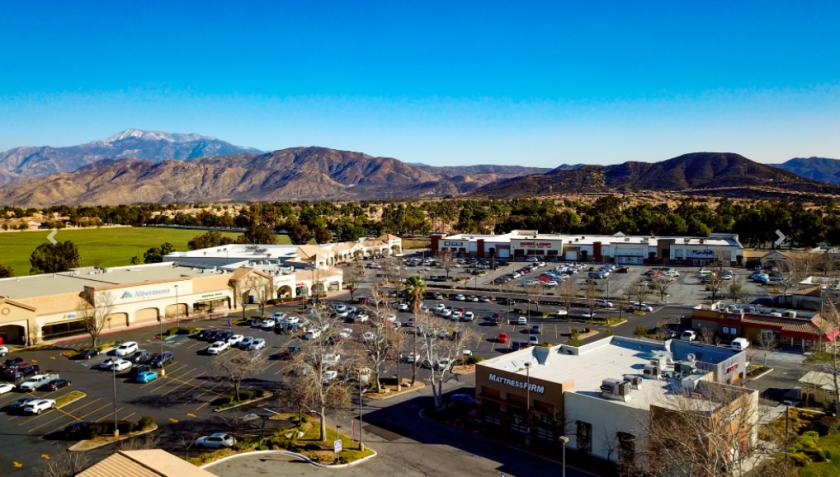
- • Signalized Intersection- high traffic density.
- • Land size- 3.36 AC, Buildings 2, 6, 8, and 10
- • Easy Ingress and Egress off Int. 10 fwy
- • Parking- 4.7 1000 SF
Listing Agents

Lynn Coker
M: 949-584-6189
lcoker@naicapital.com
M: 949-584-6189
lcoker@naicapital.com
While we strive to provide the most accurate information, all listing information, and demographic data, is provided by third-parties. As such, MyEListing will not be responsible for the accuracy of the information. It is strongly recommended that you verify all information with the listing agent, and any relevant agencies, prior to making any decisions.