Commercial Land
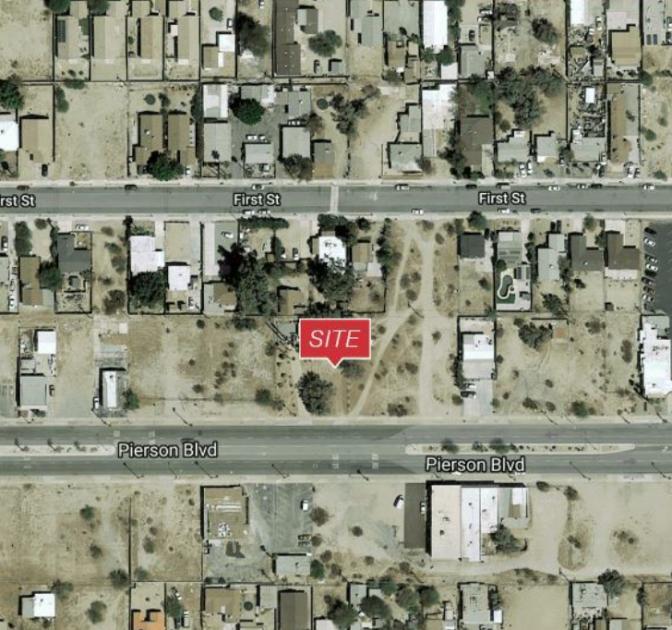
66146 Pierson Boulevard Desert Hot Springs, CA 92240
66146 Pierson Boulevard Desert Hot Springs, CA 92240
Details & Description
Property Highlights
- • City Parcel 11
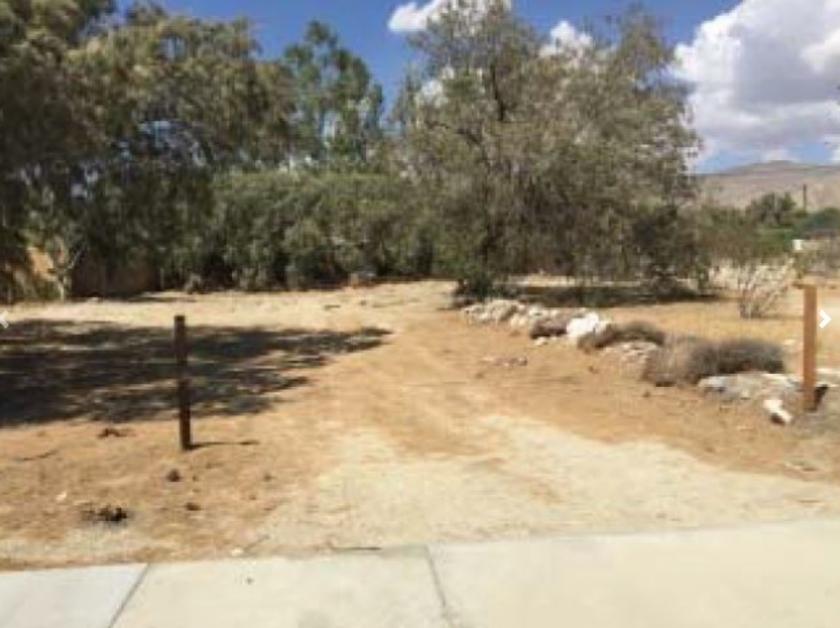
- • .15 Acre of Vacant Land
- • Site is Curbed
- • Near Community Center
- • Government Center is 12 Block Away
- • Near Elementary and High Schools
Listing Agents

Lynn Coker
M: 949-584-6189
lcoker@naicapital.com
M: 949-584-6189
lcoker@naicapital.com
While we strive to provide the most accurate information, all listing information, and demographic data, is provided by third-parties. As such, MyEListing will not be responsible for the accuracy of the information. It is strongly recommended that you verify all information with the listing agent, and any relevant agencies, prior to making any decisions.