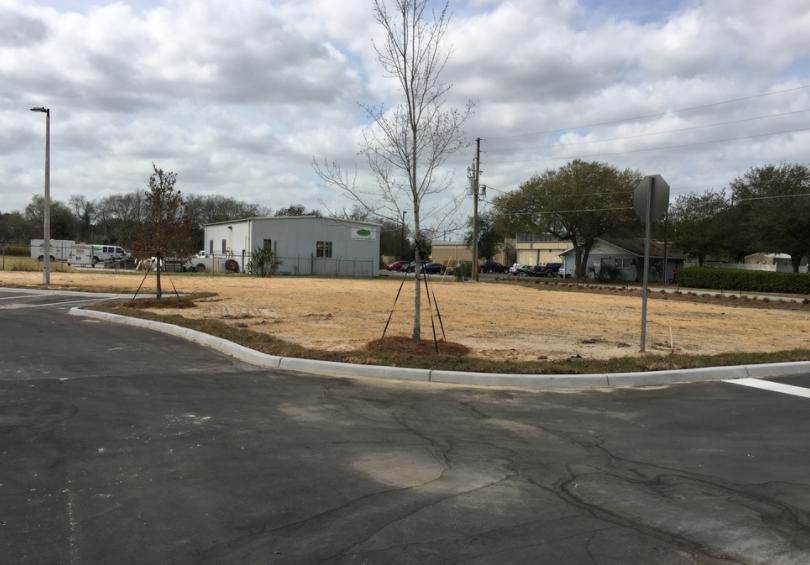
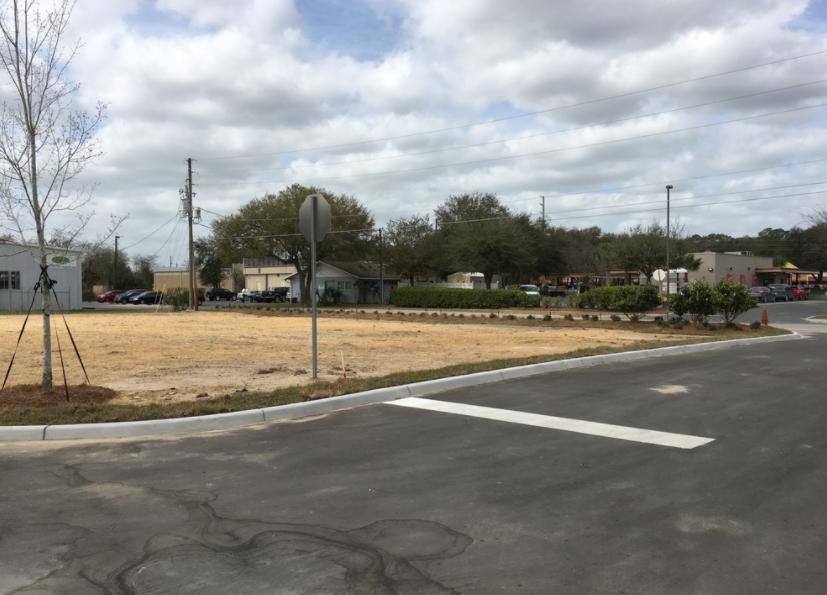
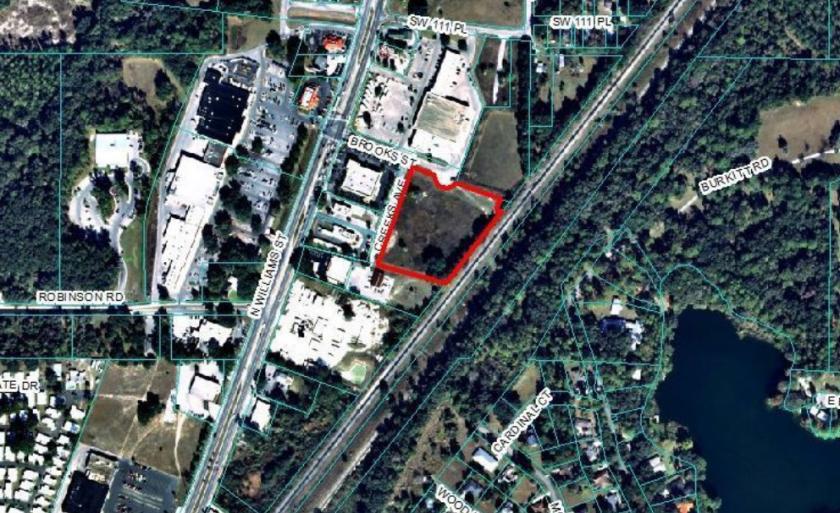
1-Mile | 3-Miles | 5-Miles | ||
---|---|---|---|---|
Total Population | 228 | 4,328 | 14,060 | |
Population Median Age | 46 | 49 | 48 | |
Population by Age | 0-9 Yrs | 17 (7%) | 327 (7%) | 1205 (8%) |
10-19 Yrs | 36 (15%) | 565 (13%) | 1671 (11%) | |
20-29 Yrs | 14 (6%) | 226 (5%) | 894 (6%) | |
30-39 Yrs | 22 (9%) | 365 (8%) | 1218 (8%) | |
40-49 Yrs | 17 (7%) | 388 (8%) | 1393 (9%) | |
50-59 Yrs | 36 (15%) | 616 (14%) | 1970 (14%) | |
60-69 Yrs | 35 (15%) | 783 (18%) | 2463 (17%) | |
70+ Yrs | 50 (21%) | 1057 (24%) | 3246 (23%) | |
Median HH Income | $34,417 | $39,392 | $41,751 | |
Total Household Income | < 24K | 37 (35%) | 587 (30%) | 1670 (27%) |
25-49K | 35 (33%) | 624 (32%) | 1963 (32%) | |
50-74K | 13 (12%) | 278 (14%) | 1061 (17%) | |
75-99K | 8 (7%) | 218 (11%) | 701 (11%) | |
100-199K | 8 (7%) | 175 (9%) | 563 (9%) | |
200K+ | 2 (1%) | 24 (1%) | 67 (1%) | |
Highest Education Level | No Diploma | 27 | 439 | 1336 |
Diploma or GED | 57 | 1255 | 4152 | |
Some College | 48 | 817 | 2595 | |
Assoc. Degree | 8 | 271 | 926 | |
Bachelors Degree | 19 | 348 | 1197 | |
Higher Degree | 10 | 190 | 579 | |
Total Housing Units | 134 | 2,301 | 7,337 | |
--Owner-Occupied | 65 | 1,578 | 5,050 | |
--Renter-Occupied | 38 | 327 | 976 | |
Owner-Occupied Values | < 100K | 28 | 454 | 1400 |
100-199K | 21 | 764 | 2622 | |
200-299K | 10 | 255 | 732 | |
300-399K | 1 | 55 | 168 | |
400-499K | 4 | 30 | 74 | |
500K+ | 1 | 20 | 53 | |
Total Working Age Population | 187 | 3,574 | 11,616 | |
In Work Force | 76 | 1,434 | 4,964 | |
Not In Work Force | 111 | 2,139 | 6,652 | |
Workforce Employed | 67 | 1,332 | 4,597 | |
Workforce Unemployed | 9 | 103 | 368 | |
Civlian Workforce | 76 | 1,434 | 4,964 | |
Military Workforce | 0 | 0 | 0 | |
Total Households | 103 | 1,905 | 6,026 | |
Family Households | 55 | 1,168 | 3,815 | |
Non-Family Households | 48 | 737 | 2,211 | |
Married Couple | 35 | 870 | 2,890 | |
Other Family | 20 | 299 | 925 | |
Married w/Child | 5 | 121 | 463 | |
Single Male w/Child | 6 | 33 | 102 | |
Single Female w/Child | 9 | 143 | 408 |
Population Change Last Two Decades - Plus Projection
2000 | % | 2010 | % | 2020 | % | 2030 | |
---|---|---|---|---|---|---|---|
Florida | 15,982,378 | +18 | 18,801,310 | +14 | 21,517,610 | +13 | 24,340,457 |
Citrus County | 118,085 | +20 | 141,236 | +5 | 148,588 | +8 | 161,148 |
Levy County | 34,450 | +18 | 40,801 | +2 | 41,635 | +6 | 43,970 |
Marion County | 258,916 | +28 | 331,298 | +10 | 363,726 | +12 | 406,228 |
Total Working Age Population:
Total Households:
Total Working Age Population:
Total Households:
Total Working Age Population:
Total Households: