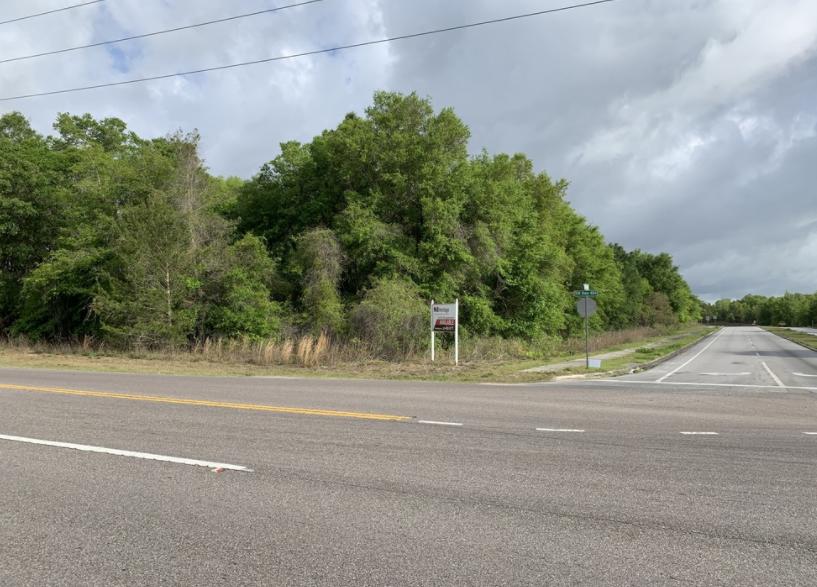
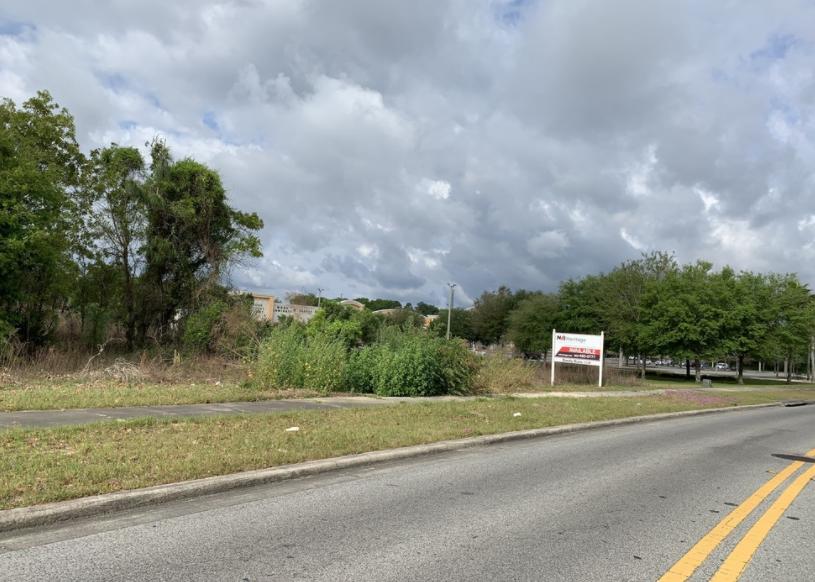
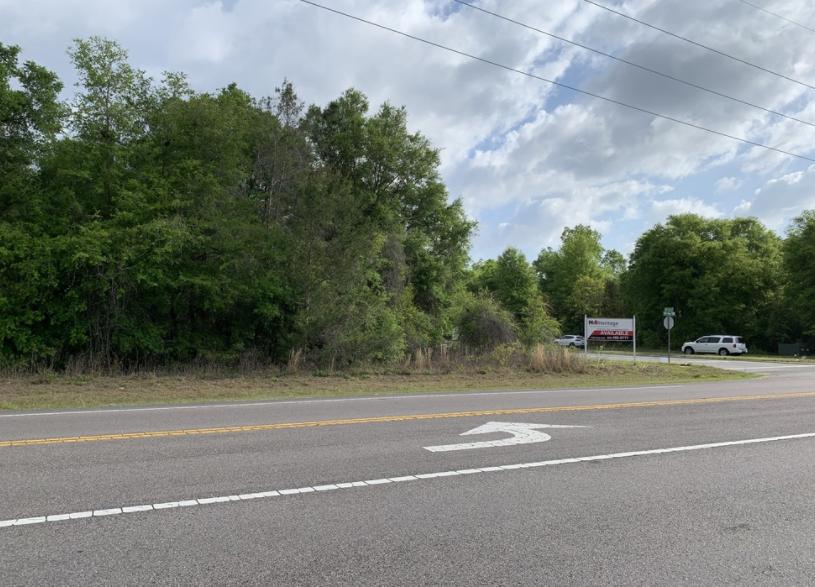
1-Mile | 3-Miles | 5-Miles | ||
---|---|---|---|---|
Total Population | 2,753 | 19,277 | 37,634 | |
Population Median Age | 65 | 62 | 56 | |
Population by Age | 0-9 Yrs | 49 (1%) | 733 (3%) | 2192 (5%) |
10-19 Yrs | 65 (2%) | 876 (4%) | 2612 (6%) | |
20-29 Yrs | 67 (2%) | 758 (3%) | 2426 (6%) | |
30-39 Yrs | 117 (4%) | 1019 (5%) | 2466 (6%) | |
40-49 Yrs | 68 (2%) | 777 (4%) | 2578 (6%) | |
50-59 Yrs | 394 (14%) | 1863 (9%) | 3872 (10%) | |
60-69 Yrs | 649 (23%) | 4086 (21%) | 7358 (19%) | |
70+ Yrs | 1345 (48%) | 9166 (47%) | 14129 (37%) | |
Median HH Income | $46,283 | $47,012 | $49,196 | |
Total Household Income | < 24K | 388 (26%) | 2033 (20%) | 3372 (19%) |
25-49K | 383 (26%) | 3137 (31%) | 5464 (31%) | |
50-74K | 346 (23%) | 2218 (22%) | 3919 (22%) | |
75-99K | 226 (15%) | 1292 (13%) | 2322 (13%) | |
100-199K | 106 (7%) | 989 (10%) | 2064 (11%) | |
200K+ | 12 (0%) | 139 (1%) | 274 (1%) | |
Highest Education Level | No Diploma | 185 | 1124 | 2532 |
Diploma or GED | 905 | 5529 | 10145 | |
Some College | 489 | 4346 | 7844 | |
Assoc. Degree | 329 | 1733 | 3119 | |
Bachelors Degree | 550 | 3116 | 5404 | |
Higher Degree | 135 | 1368 | 2594 | |
Total Housing Units | 1,699 | 11,509 | 20,200 | |
--Owner-Occupied | 1,348 | 8,769 | 15,317 | |
--Renter-Occupied | 112 | 1,038 | 2,098 | |
Owner-Occupied Values | < 100K | 589 | 2896 | 4401 |
100-199K | 662 | 4460 | 7460 | |
200-299K | 48 | 1035 | 2566 | |
300-399K | 41 | 266 | 587 | |
400-499K | 6 | 63 | 187 | |
500K+ | 2 | 49 | 115 | |
Total Working Age Population | 2,673 | 18,059 | 33,882 | |
In Work Force | 574 | 4,381 | 10,956 | |
Not In Work Force | 2,099 | 13,678 | 22,926 | |
Workforce Employed | 526 | 3,969 | 9,960 | |
Workforce Unemployed | 48 | 412 | 996 | |
Civlian Workforce | 574 | 4,381 | 10,956 | |
Military Workforce | 0 | 0 | 0 | |
Total Households | 1,460 | 9,807 | 17,415 | |
Family Households | 836 | 5,878 | 11,254 | |
Non-Family Households | 624 | 3,929 | 6,160 | |
Married Couple | 690 | 5,087 | 9,496 | |
Other Family | 146 | 791 | 1,759 | |
Married w/Child | 22 | 408 | 1,186 | |
Single Male w/Child | 0 | 7 | 70 | |
Single Female w/Child | 9 | 112 | 446 |
Population Change Last Two Decades - Plus Projection
2000 | % | 2010 | % | 2020 | % | 2030 | |
---|---|---|---|---|---|---|---|
Florida | 15,982,378 | +18 | 18,801,310 | +14 | 21,517,610 | +13 | 24,340,457 |
Citrus County | 118,085 | +20 | 141,236 | +5 | 148,588 | +8 | 161,148 |
Marion County | 258,916 | +28 | 331,298 | +10 | 363,726 | +12 | 406,228 |
Total Working Age Population:
Total Households:
Total Working Age Population:
Total Households:
Total Working Age Population:
Total Households: