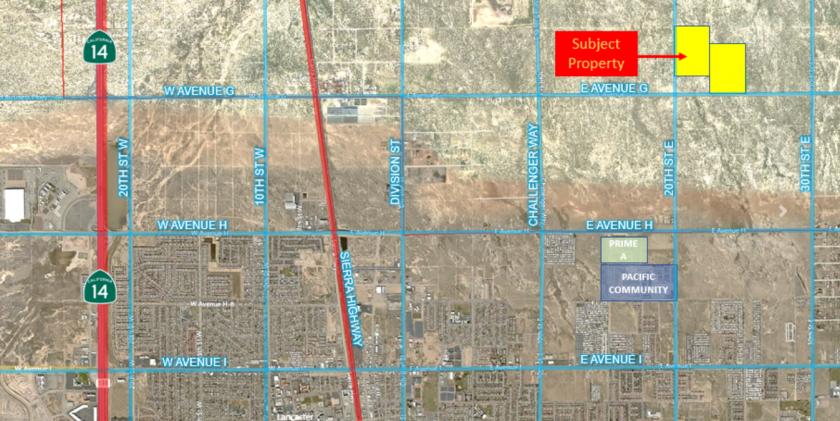
1-Mile | 3-Miles | 5-Miles | ||
---|---|---|---|---|
Total Population | 13,644 | 64,847 | 109,830 | |
Population Median Age | 33 | 33 | 34 | |
Population by Age | 0-9 Yrs | 2583 (18%) | 11422 (17%) | 18511 (16%) |
10-19 Yrs | 2236 (16%) | 11030 (17%) | 18025 (16%) | |
20-29 Yrs | 1979 (14%) | 9969 (15%) | 16582 (15%) | |
30-39 Yrs | 1518 (11%) | 7542 (11%) | 13623 (12%) | |
40-49 Yrs | 1827 (13%) | 7957 (12%) | 12986 (11%) | |
50-59 Yrs | 1707 (12%) | 8112 (12%) | 13507 (12%) | |
60-69 Yrs | 1083 (7%) | 4995 (7%) | 9228 (8%) | |
70+ Yrs | 710 (5%) | 3819 (5%) | 7368 (6%) | |
Median HH Income | $49,214 | $45,887 | $45,900 | |
Total Household Income | < 24K | 1234 (30%) | 5961 (31%) | 10605 (30%) |
25-49K | 849 (20%) | 4322 (22%) | 8249 (23%) | |
50-74K | 876 (21%) | 3350 (17%) | 6277 (18%) | |
75-99K | 557 (13%) | 2332 (12%) | 3998 (11%) | |
100-199K | 495 (12%) | 2567 (13%) | 4601 (13%) | |
200K+ | 95 (2%) | 407 (2%) | 729 (2%) | |
Highest Education Level | No Diploma | 1587 | 7958 | 12858 |
Diploma or GED | 2424 | 12830 | 20767 | |
Some College | 2023 | 9189 | 16583 | |
Assoc. Degree | 872 | 3490 | 6543 | |
Bachelors Degree | 689 | 2918 | 5957 | |
Higher Degree | 279 | 1299 | 2975 | |
Total Housing Units | 4,382 | 20,556 | 37,790 | |
--Owner-Occupied | 2,174 | 10,228 | 16,072 | |
--Renter-Occupied | 1,933 | 8,710 | 18,388 | |
Owner-Occupied Values | < 100K | 742 | 2287 | 2642 |
100-199K | 276 | 2399 | 4006 | |
200-299K | 716 | 3978 | 6425 | |
300-399K | 388 | 1143 | 2186 | |
400-499K | 9 | 135 | 299 | |
500K+ | 43 | 286 | 513 | |
Total Working Age Population | 9,910 | 46,711 | 80,393 | |
In Work Force | 5,145 | 23,650 | 41,057 | |
Not In Work Force | 4,765 | 23,061 | 39,335 | |
Workforce Employed | 4,820 | 21,840 | 38,051 | |
Workforce Unemployed | 324 | 1,778 | 2,897 | |
Civlian Workforce | 5,144 | 23,618 | 40,948 | |
Military Workforce | 1 | 32 | 109 | |
Total Households | 4,106 | 18,938 | 34,460 | |
Family Households | 3,245 | 14,800 | 24,666 | |
Non-Family Households | 862 | 4,138 | 9,794 | |
Married Couple | 1,858 | 8,805 | 14,816 | |
Other Family | 1,387 | 5,996 | 9,851 | |
Married w/Child | 916 | 4,458 | 7,353 | |
Single Male w/Child | 119 | 500 | 942 | |
Single Female w/Child | 508 | 2,526 | 4,321 |
Population Change Last Two Decades - Plus Projection
2000 | % | 2010 | % | 2020 | % | 2030 | |
---|---|---|---|---|---|---|---|
California | 33,871,648 | +10 | 37,253,956 | +9 | 40,467,295 | +8 | 43,631,295 |
Los Angeles County | 9,519,338 | +3 | 9,818,605 | +6 | 10,369,367 | +4 | 10,759,850 |
Total Working Age Population:
Total Households:
Total Working Age Population:
Total Households:
Total Working Age Population:
Total Households: