Commercial Land
Siskiyou Rd Apple Valley, CA 92307
Siskiyou Rd Apple Valley, CA 92307
Details & Description
Property Highlights
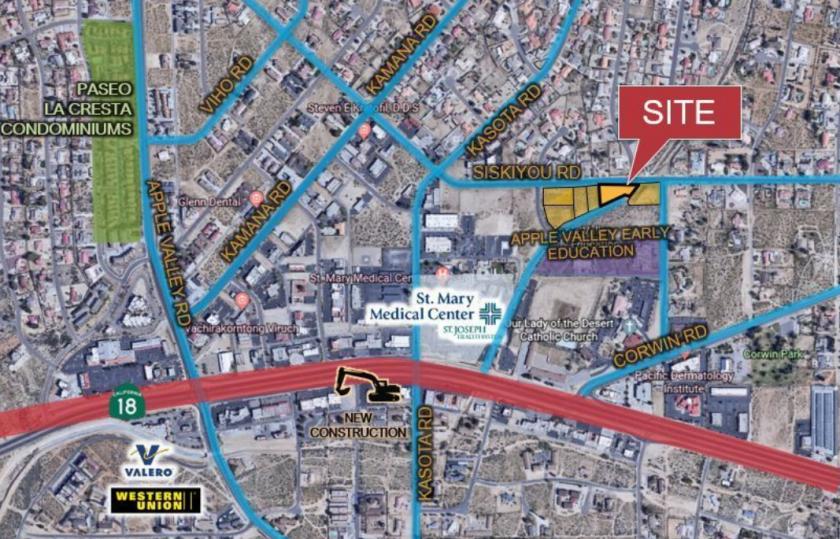
- • In the Heart of Apple Valleys Medical Community
- • Adjacent to renowned St. Mary Hospital
- • Ideal for Medical Services
- • Rough Graded Pad - Ready to Build
- • Adjacent Parcels For Sale
Listing Agents

Mehdi Mostaedi
M: 760-559-6807
mmostaedi@naicapital.com
M: 760-559-6807
mmostaedi@naicapital.com
While we strive to provide the most accurate information, all listing information, and demographic data, is provided by third-parties. As such, MyEListing will not be responsible for the accuracy of the information. It is strongly recommended that you verify all information with the listing agent, and any relevant agencies, prior to making any decisions.