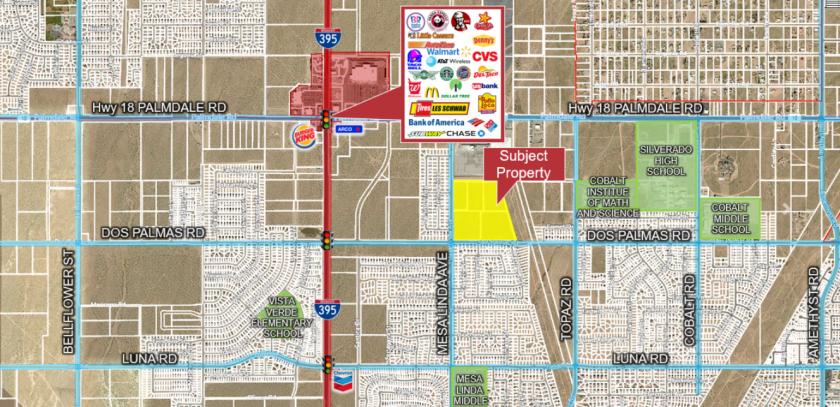
1-Mile | 3-Miles | 5-Miles | ||
---|---|---|---|---|
Total Population | 7,851 | 68,743 | 132,456 | |
Population Median Age | 33 | 32 | 32 | |
Population by Age | 0-9 Yrs | 1227 (15%) | 12532 (18%) | 24268 (18%) |
10-19 Yrs | 1500 (19%) | 12443 (18%) | 23397 (17%) | |
20-29 Yrs | 1027 (13%) | 9429 (13%) | 19048 (14%) | |
30-39 Yrs | 883 (11%) | 9774 (14%) | 18317 (13%) | |
40-49 Yrs | 1225 (15%) | 8439 (12%) | 15018 (11%) | |
50-59 Yrs | 1025 (13%) | 7746 (11%) | 15092 (11%) | |
60-69 Yrs | 636 (8%) | 5139 (7%) | 9677 (7%) | |
70+ Yrs | 326 (4%) | 3241 (4%) | 7640 (5%) | |
Median HH Income | $74,780 | $64,569 | $57,510 | |
Total Household Income | < 24K | 207 (9%) | 2646 (14%) | 6840 (19%) |
25-49K | 561 (25%) | 4404 (24%) | 8993 (25%) | |
50-74K | 322 (14%) | 3818 (21%) | 6817 (19%) | |
75-99K | 346 (15%) | 2856 (15%) | 4901 (13%) | |
100-199K | 590 (27%) | 3740 (20%) | 6760 (19%) | |
200K+ | 145 (6%) | 482 (2%) | 901 (2%) | |
Highest Education Level | No Diploma | 773 | 8727 | 17501 |
Diploma or GED | 991 | 11165 | 22748 | |
Some College | 1428 | 10996 | 20355 | |
Assoc. Degree | 479 | 3267 | 6282 | |
Bachelors Degree | 422 | 3004 | 6007 | |
Higher Degree | 439 | 1911 | 3196 | |
Total Housing Units | 2,378 | 19,201 | 37,745 | |
--Owner-Occupied | 1,348 | 10,934 | 20,339 | |
--Renter-Occupied | 822 | 7,012 | 14,873 | |
Owner-Occupied Values | < 100K | 61 | 466 | 1593 |
100-199K | 220 | 2573 | 5551 | |
200-299K | 866 | 6344 | 10383 | |
300-399K | 187 | 1190 | 2140 | |
400-499K | 1 | 99 | 238 | |
500K+ | 12 | 262 | 432 | |
Total Working Age Population | 5,872 | 48,650 | 93,783 | |
In Work Force | 3,451 | 28,601 | 53,857 | |
Not In Work Force | 2,421 | 20,049 | 39,926 | |
Workforce Employed | 3,215 | 25,490 | 47,619 | |
Workforce Unemployed | 236 | 3,063 | 6,117 | |
Civlian Workforce | 3,451 | 28,552 | 53,736 | |
Military Workforce | 0 | 49 | 121 | |
Total Households | 2,170 | 17,946 | 35,212 | |
Family Households | 1,702 | 14,823 | 28,085 | |
Non-Family Households | 469 | 3,123 | 7,127 | |
Married Couple | 1,099 | 9,517 | 17,115 | |
Other Family | 603 | 5,306 | 10,970 | |
Married w/Child | 504 | 5,002 | 9,182 | |
Single Male w/Child | 107 | 932 | 1,880 | |
Single Female w/Child | 302 | 1,809 | 4,012 |
Population Change Last Two Decades - Plus Projection
2000 | % | 2010 | % | 2020 | % | 2030 | |
---|---|---|---|---|---|---|---|
California | 33,871,648 | +10 | 37,253,956 | +9 | 40,467,295 | +8 | 43,631,295 |
San Bernardino County | 1,709,434 | +19 | 2,035,210 | +9 | 2,223,189 | +11 | 2,468,202 |
Total Working Age Population:
Total Households:
Total Working Age Population:
Total Households:
Total Working Age Population:
Total Households: