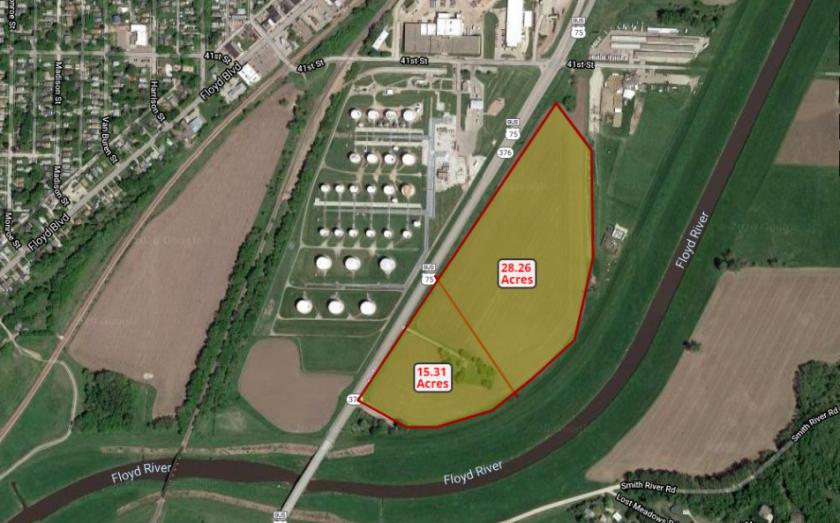
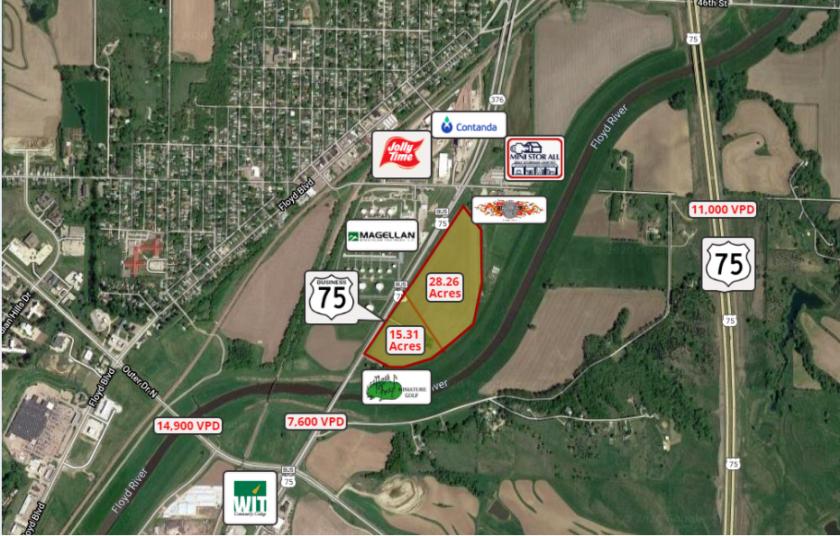
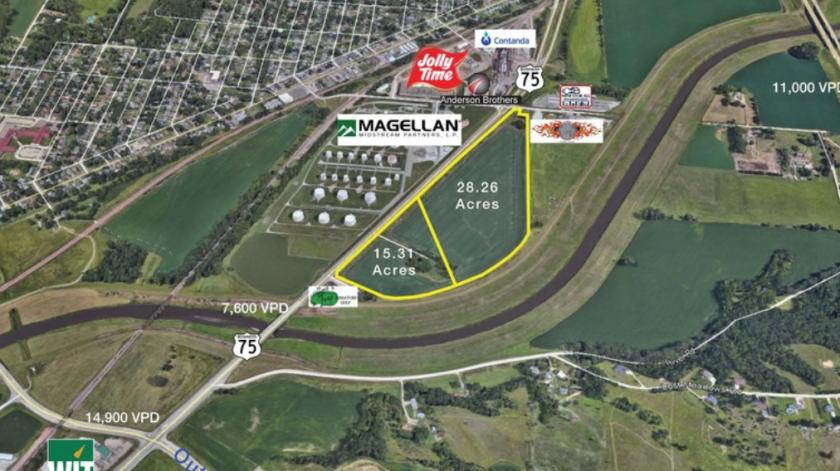
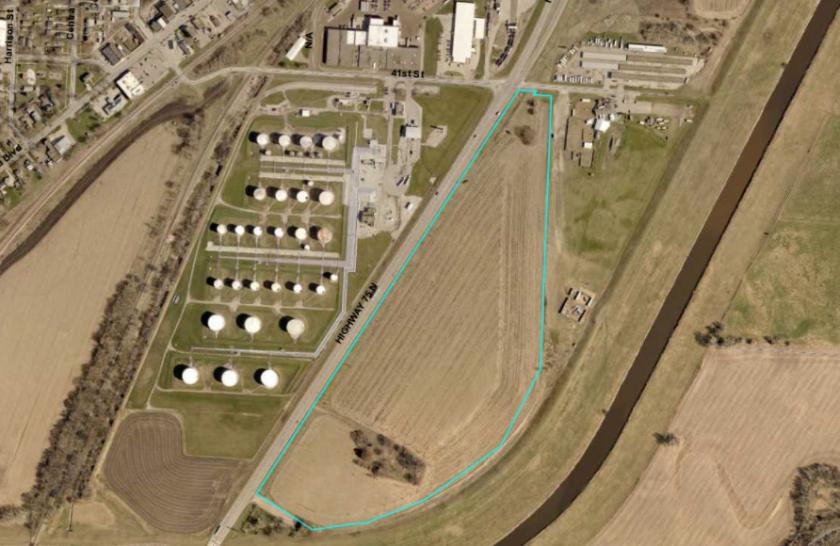
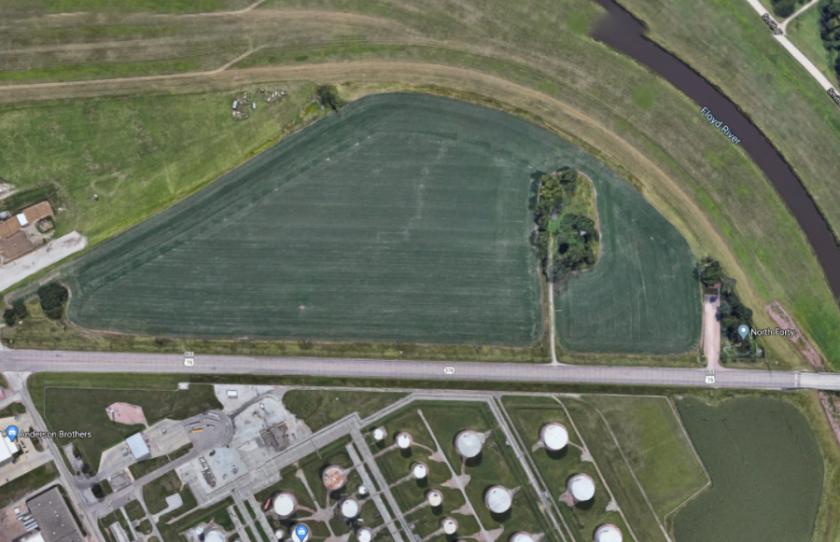
1-Mile | 3-Miles | 5-Miles | ||
---|---|---|---|---|
Total Population | 3,443 | 28,774 | 73,342 | |
Population Median Age | 36 | 36 | 36 | |
Population by Age | 0-9 Yrs | 479 (13%) | 4369 (15%) | 10775 (14%) |
10-19 Yrs | 538 (15%) | 4074 (14%) | 11264 (15%) | |
20-29 Yrs | 469 (13%) | 4436 (15%) | 11345 (15%) | |
30-39 Yrs | 469 (13%) | 3837 (13%) | 9954 (13%) | |
40-49 Yrs | 418 (12%) | 3329 (11%) | 8174 (11%) | |
50-59 Yrs | 457 (13%) | 3064 (10%) | 8115 (11%) | |
60-69 Yrs | 302 (8%) | 3016 (10%) | 7618 (10%) | |
70+ Yrs | 312 (9%) | 2649 (9%) | 6098 (8%) | |
Median HH Income | $58,395 | $58,089 | $54,450 | |
Total Household Income | < 24K | 207 (15%) | 2068 (19%) | 5832 (21%) |
25-49K | 306 (23%) | 2453 (22%) | 6675 (24%) | |
50-74K | 314 (24%) | 2157 (19%) | 5724 (20%) | |
75-99K | 185 (14%) | 1571 (14%) | 3796 (13%) | |
100-199K | 274 (20%) | 2216 (20%) | 4726 (17%) | |
200K+ | 21 (1%) | 351 (3%) | 740 (2%) | |
Highest Education Level | No Diploma | 294 | 2804 | 7480 |
Diploma or GED | 776 | 5721 | 14997 | |
Some College | 491 | 3691 | 9373 | |
Assoc. Degree | 231 | 1937 | 4444 | |
Bachelors Degree | 276 | 2960 | 6436 | |
Higher Degree | 70 | 1249 | 2779 | |
Total Housing Units | 1,404 | 11,638 | 29,796 | |
--Owner-Occupied | 1,058 | 7,035 | 16,446 | |
--Renter-Occupied | 248 | 3,781 | 11,047 | |
Owner-Occupied Values | < 100K | 617 | 2814 | 7283 |
100-199K | 348 | 3183 | 7093 | |
200-299K | 79 | 725 | 1372 | |
300-399K | 14 | 189 | 428 | |
400-499K | 0 | 61 | 140 | |
500K+ | 0 | 63 | 129 | |
Total Working Age Population | 2,525 | 21,511 | 55,442 | |
In Work Force | 1,843 | 15,209 | 38,736 | |
Not In Work Force | 682 | 6,303 | 16,706 | |
Workforce Employed | 1,824 | 14,708 | 36,693 | |
Workforce Unemployed | 19 | 479 | 1,991 | |
Civlian Workforce | 1,843 | 15,187 | 38,684 | |
Military Workforce | 0 | 22 | 52 | |
Total Households | 1,306 | 10,816 | 27,493 | |
Family Households | 849 | 7,309 | 17,651 | |
Non-Family Households | 457 | 3,507 | 9,842 | |
Married Couple | 678 | 5,097 | 11,499 | |
Other Family | 171 | 2,212 | 6,152 | |
Married w/Child | 312 | 2,017 | 5,094 | |
Single Male w/Child | 5 | 355 | 1,019 | |
Single Female w/Child | 105 | 1,085 | 2,784 |
Population Change Last Two Decades - Plus Projection
2000 | % | 2010 | % | 2020 | % | 2030 | |
---|---|---|---|---|---|---|---|
Iowa | 2,926,324 | +4 | 3,046,355 | -100 | |||
Plymouth County | 24,849 | +1 | 24,986 | -100 | |||
Woodbury County | 103,877 | -2 | 102,172 | -100 | |||
Nebraska | 1,711,263 | +7 | 1,826,341 | +6 | 1,943,452 | +6 | 2,053,788 |
Dakota County | 20,253 | +4 | 21,006 | +5 | 21,975 | +3 | 22,639 |
South Dakota | 754,844 | +8 | 814,180 | +9 | 889,447 | +7 | 951,885 |
Union County | 12,584 | +14 | 14,399 | +16 | 16,659 | +14 | 18,929 |
Total Working Age Population:
Total Households:
Total Working Age Population:
Total Households:
Total Working Age Population:
Total Households: