Commercial Land
W of SWC Wilmot and 5th Street Tucson, AZ 85711
W of SWC Wilmot and 5th Street Tucson, AZ 85711
Details & Description
Property Highlights
• Zoning OCR-2, City of Tucson High Rise Mixed Use Office, Commercial Residential
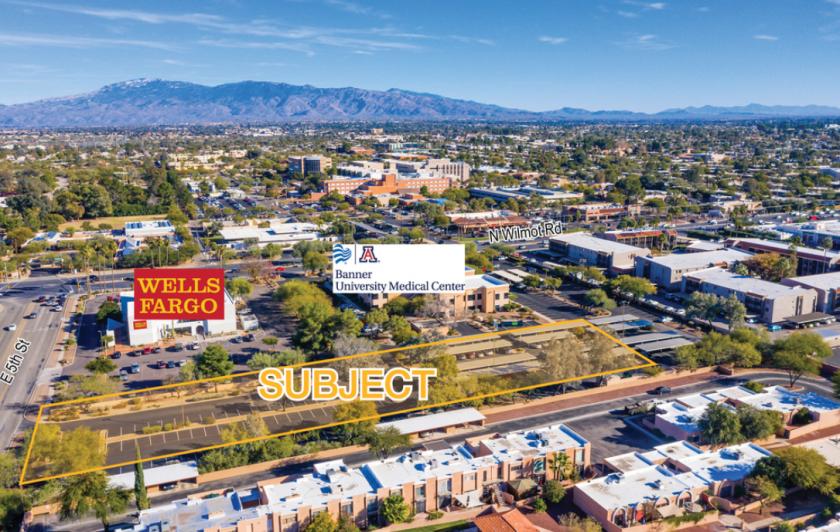
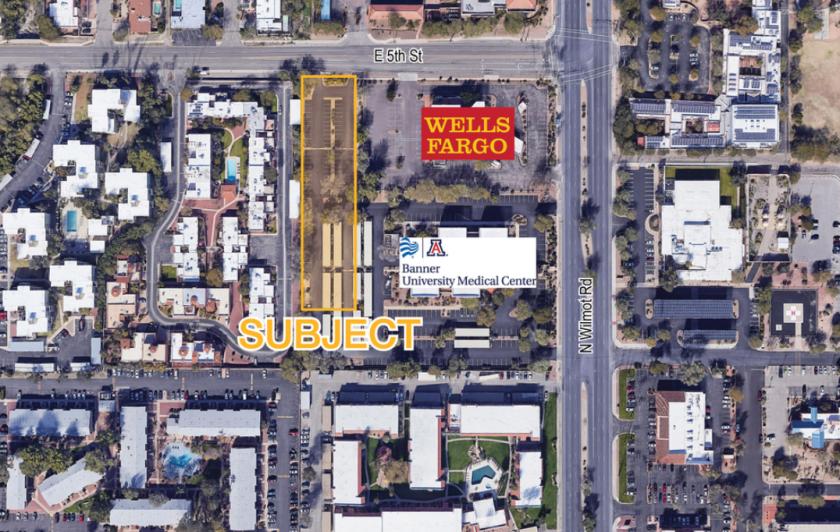
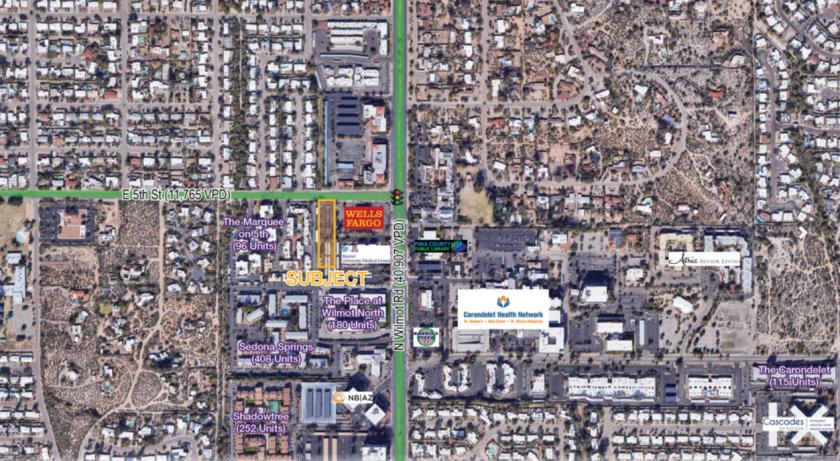
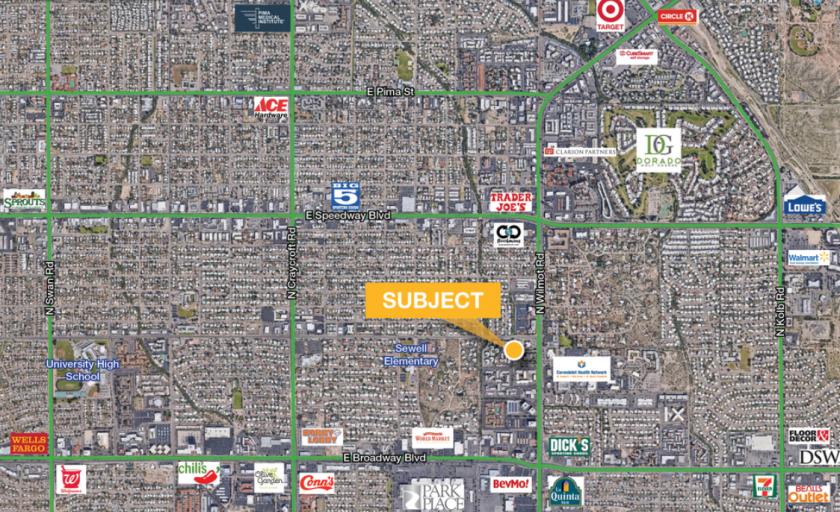
• Location 1 Parcel West of the Southwest Corner of Wilmot Road 5th Street
Additional Photos
Listing Agents

Mike Chapman
O: 520-999-3728
M: 520-591-5188
mike.chapman@naihorizon.com
O: 520-999-3728
M: 520-591-5188
mike.chapman@naihorizon.com
While we strive to provide the most accurate information, all listing information, and demographic data, is provided by third-parties. As such, MyEListing will not be responsible for the accuracy of the information. It is strongly recommended that you verify all information with the listing agent, and any relevant agencies, prior to making any decisions.


