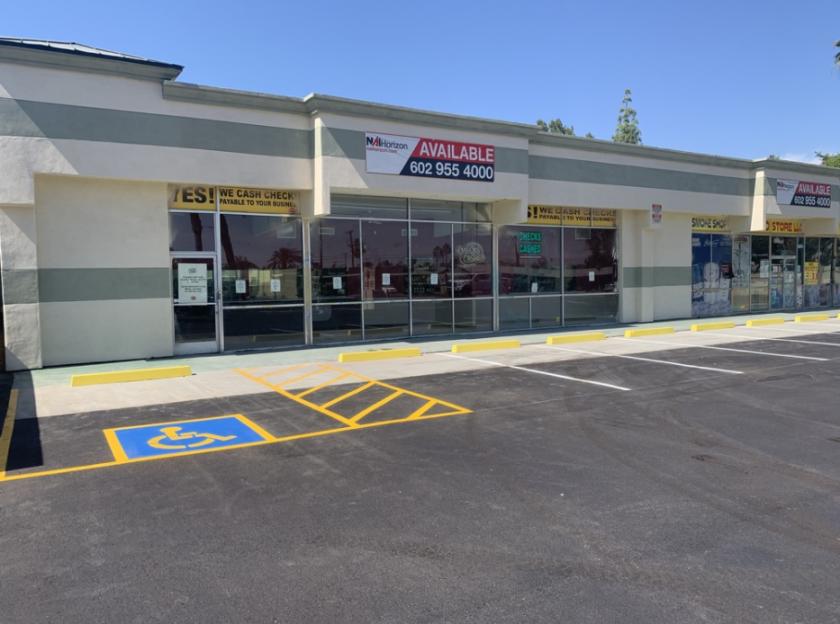
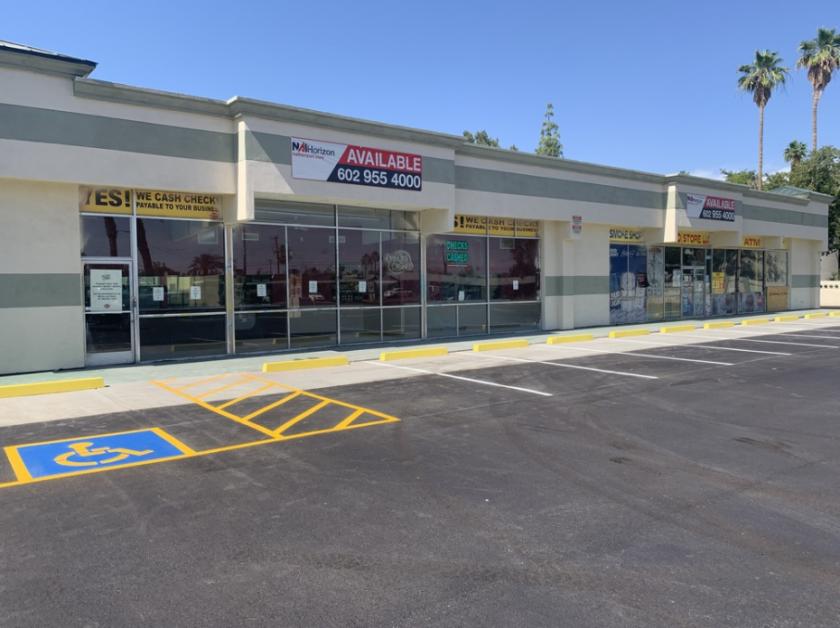
Retail Space
1324 West University Drive Tempe, AZ 85281
1324 West University Drive Tempe, AZ 85281
Details & Description
Property Highlights
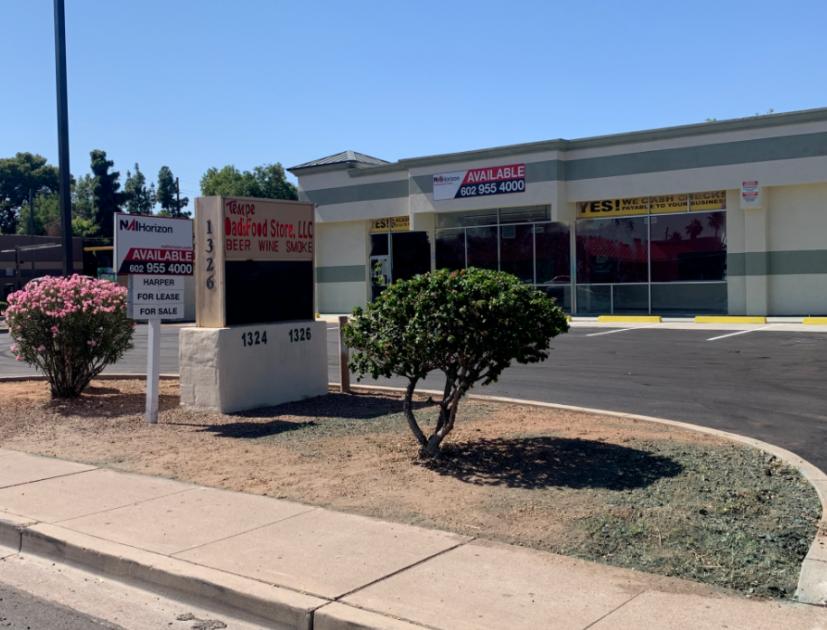
- • Monument signage on University
- • Surrounded by apartments and residential
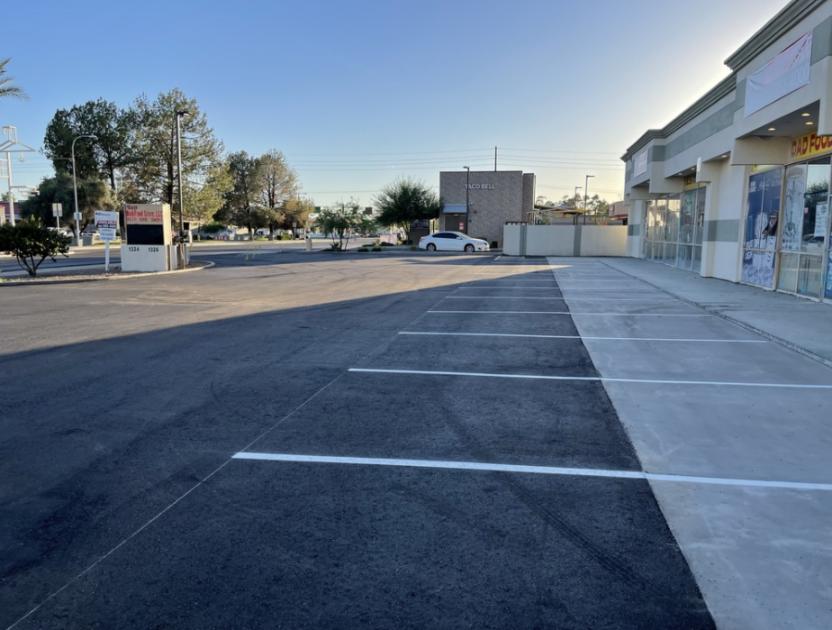
- • Adjacent to Taco Bell
- • Near large employers
- • Great daytime population
- • Less than 2 miles to ASU
Additional Photos
Listing Agents

Matt Harper
O: 602-393-6604
M: 623-692-9435
matt.harper@naihorizon.com
O: 602-393-6604
M: 623-692-9435
matt.harper@naihorizon.com
While we strive to provide the most accurate information, all listing information, and demographic data, is provided by third-parties. As such, MyEListing will not be responsible for the accuracy of the information. It is strongly recommended that you verify all information with the listing agent, and any relevant agencies, prior to making any decisions.


