Commercial Land
Dysart Rd and Van Buren Avondale, AZ 85323
Dysart Rd and Van Buren Avondale, AZ 85323
Details & Description
Property Highlights
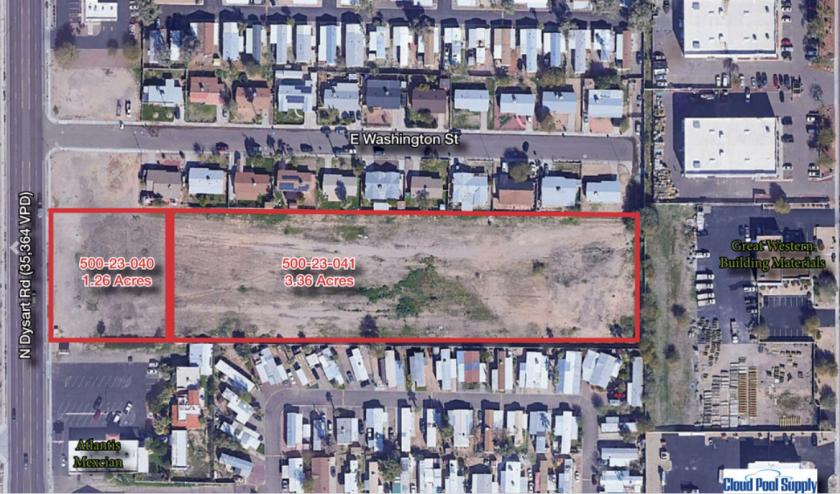
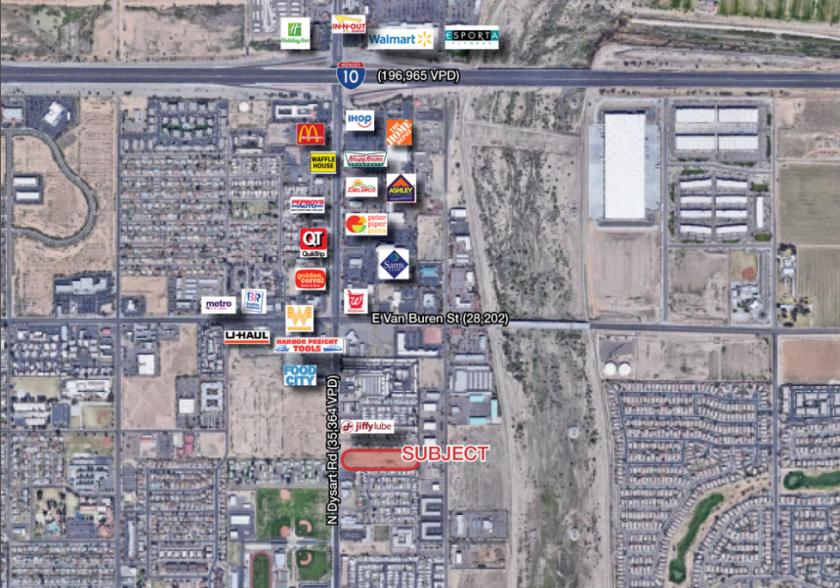
- • Dysart road frontage
- • Fully improved with existing curb cut
- • C-2 zoning
- • 4.62 Acres of C-2 land in Historic Avondale
- • All utilities on site
- • Only $3.47SF
Listing Agents

Matt Harper
O: 602-393-6604
M: 623-692-9435
matt.harper@naihorizon.com
O: 602-393-6604
M: 623-692-9435
matt.harper@naihorizon.com
While we strive to provide the most accurate information, all listing information, and demographic data, is provided by third-parties. As such, MyEListing will not be responsible for the accuracy of the information. It is strongly recommended that you verify all information with the listing agent, and any relevant agencies, prior to making any decisions.