Retail Space
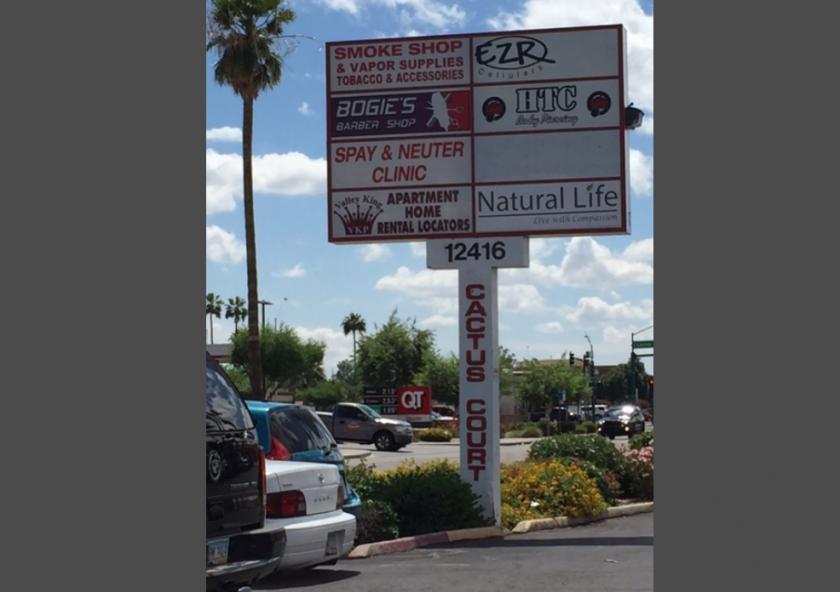
12416 North 28th Drive Phoenix, AZ 85029
12416 North 28th Drive Phoenix, AZ 85029

Details & Description
Property Highlights
- • Excellent proximity to I-17 Freeway
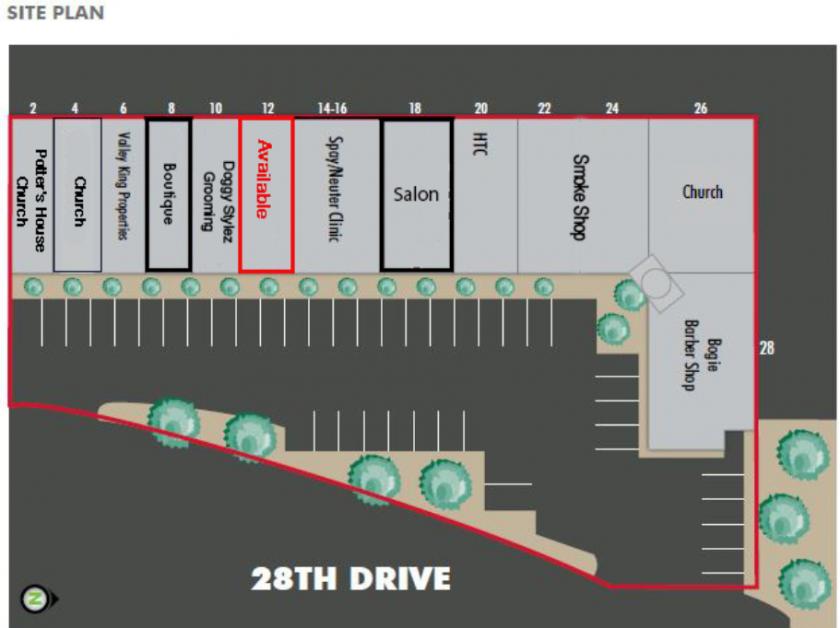
- • Great shopping synergy
- • Dense population counts within a 3-mile radius
- • Join other long-term, stable tenants
- • Close proximity to both Metro Center Metro North
Listing Agents

Matt Harper
O: 602-393-6604
M: 623-692-9435
matt.harper@naihorizon.com
O: 602-393-6604
M: 623-692-9435
matt.harper@naihorizon.com
While we strive to provide the most accurate information, all listing information, and demographic data, is provided by third-parties. As such, MyEListing will not be responsible for the accuracy of the information. It is strongly recommended that you verify all information with the listing agent, and any relevant agencies, prior to making any decisions.