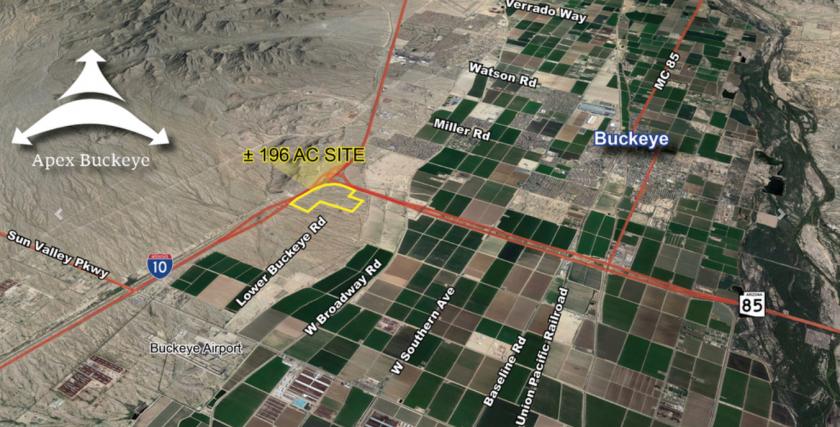
±196 Acres | Buckeye, Arizona
Highlights
Ideal Development Site For: Industrial / Multifamily / Office
Zoning: CC (Commercial Center)
Land Use: (Business Commerce (General Plan)
Utilities: Power - Arizona Public Service (APS) / Water - Town of Buckeye / Sewer - Town of Buckeye
Taxes (2020): $155.78
Opportunity Zone: The Property is located in an Opportunity Zone. Investors who reinvest capital gains monies in Opportunity Zone funds will receive reductions on capital gains taxes relatives to the years of their investment.
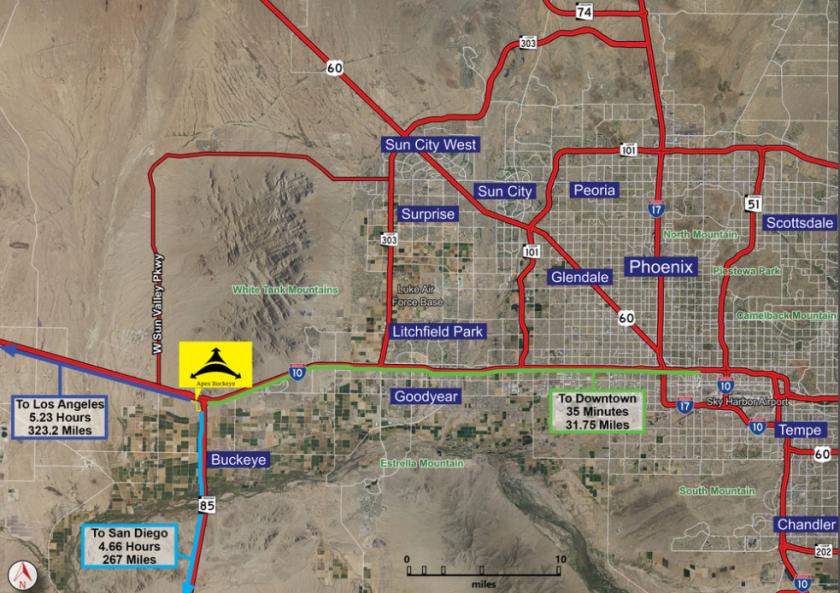
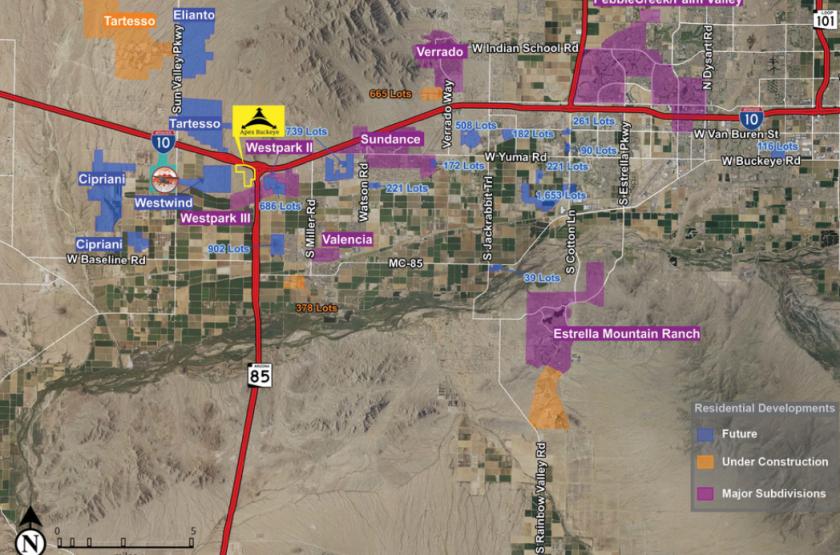
Buckeye is the fastest growing city in Arizona and in the entire U.S. Currently 92,000 people reside in Buckeye. The Town has become an emerging market for logistics, distribution, and manufacturing.
The Property is located at the southwest corner of Interstate-10 and Hwy-85. Hwy-85 is designated as part of the CANAMEX Corridor, as such it is being renamed as the future Interstate-11. The Property is fronting this new freeway system (along Hwy-85), which shall serve north/south transportation access from Mexico to Canada within the Sun Corridor.
No part of this information may be copied, reproduced, repurposed, or screen-captured for any commercial purpose without prior written authorization from MyEListing.
While we strive to provide the most accurate information, all listing information, and demographic data, is provided by third-parties. As such, MyEListing will not be responsible for the accuracy of the information. It is strongly recommended that you verify all information with the listing agent, and any relevant agencies, prior to making any decisions.
How much land does the Buckeye, AZ property at 3105 I-10 include?
3105 I-10 in Buckeye includes 196.740 acres of land
What kind of Land is the propery at 3105 I-10?
The property at 3105 I-10 Buckeye, AZ 85326 is listed as a Mixed Use Land Land property
What is the population within 1 mile of 3105 I-10 in Buckeye?
The population within 1 mile of 3105 I-10 Buckeye, AZ 85326 is 416 people.
Who do I contact for questions about 3105 I-10?
You should contact the listing agent,
Lane Neville, for any details regarding this commercial listing.