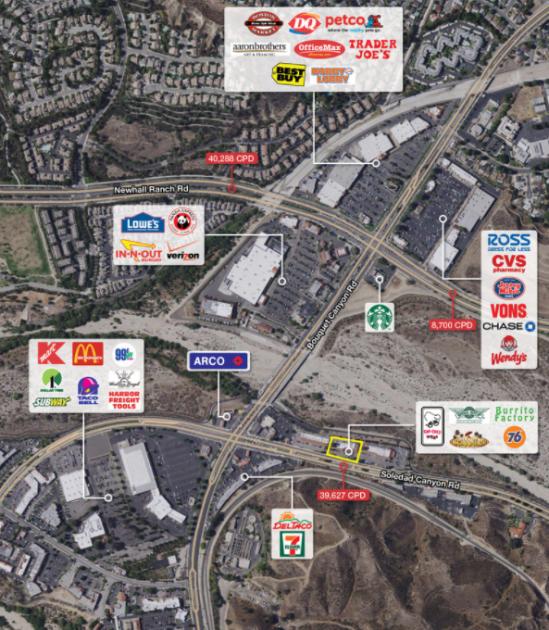
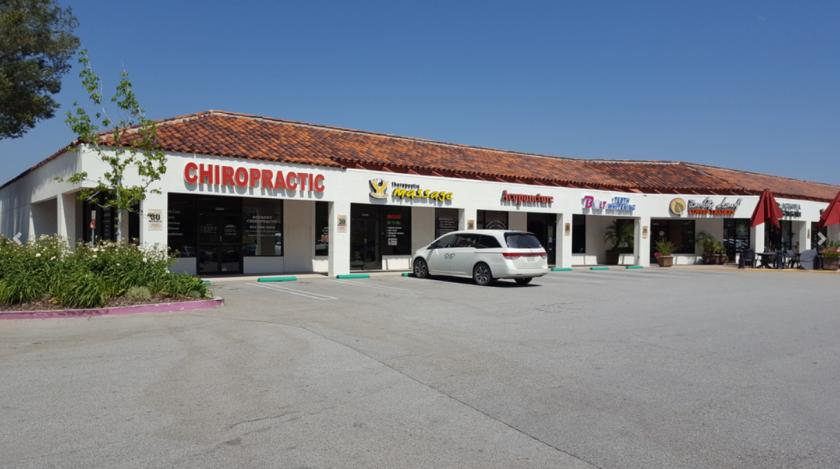
1-Mile | 3-Miles | 5-Miles | ||
---|---|---|---|---|
Total Population | 8,551 | 104,430 | 200,578 | |
Population Median Age | 39 | 37 | 37 | |
Population by Age | 0-9 Yrs | 1310 (15%) | 14281 (13%) | 27042 (13%) |
10-19 Yrs | 1014 (11%) | 14707 (14%) | 29175 (14%) | |
20-29 Yrs | 845 (9%) | 12665 (12%) | 25946 (12%) | |
30-39 Yrs | 1105 (12%) | 13327 (12%) | 26013 (12%) | |
40-49 Yrs | 1220 (14%) | 15446 (14%) | 29696 (14%) | |
50-59 Yrs | 1184 (13%) | 14982 (14%) | 28629 (14%) | |
60-69 Yrs | 953 (11%) | 10928 (10%) | 18935 (9%) | |
70+ Yrs | 920 (10%) | 8093 (7%) | 15141 (7%) | |
Median HH Income | $98,461 | $105,305 | $101,191 | |
Total Household Income | < 24K | 280 (9%) | 3094 (8%) | 6350 (9%) |
25-49K | 503 (16%) | 4290 (12%) | 8418 (13%) | |
50-74K | 350 (11%) | 4664 (13%) | 8880 (13%) | |
75-99K | 417 (13%) | 4627 (13%) | 8214 (12%) | |
100-199K | 997 (32%) | 13000 (37%) | 22591 (35%) | |
200K+ | 502 (16%) | 5358 (15%) | 9948 (15%) | |
Highest Education Level | No Diploma | 445 | 5377 | 13357 |
Diploma or GED | 996 | 11060 | 23489 | |
Some College | 1362 | 17179 | 32405 | |
Assoc. Degree | 573 | 7244 | 12852 | |
Bachelors Degree | 1609 | 19122 | 33164 | |
Higher Degree | 863 | 9532 | 16605 | |
Total Housing Units | 3,097 | 35,836 | 66,262 | |
--Owner-Occupied | 2,085 | 24,831 | 44,995 | |
--Renter-Occupied | 964 | 10,201 | 19,406 | |
Owner-Occupied Values | < 100K | 68 | 730 | 1555 |
100-199K | 89 | 682 | 1283 | |
200-299K | 75 | 754 | 2242 | |
300-399K | 331 | 2501 | 5055 | |
400-499K | 351 | 5273 | 9051 | |
500K+ | 1171 | 14891 | 25809 | |
Total Working Age Population | 6,598 | 81,041 | 155,858 | |
In Work Force | 4,340 | 54,694 | 102,904 | |
Not In Work Force | 2,258 | 26,347 | 52,955 | |
Workforce Employed | 4,125 | 51,962 | 97,727 | |
Workforce Unemployed | 209 | 2,672 | 5,112 | |
Civlian Workforce | 4,334 | 54,633 | 102,839 | |
Military Workforce | 6 | 60 | 65 | |
Total Households | 3,050 | 35,032 | 64,401 | |
Family Households | 2,214 | 26,165 | 48,059 | |
Non-Family Households | 836 | 8,867 | 16,343 | |
Married Couple | 1,707 | 21,369 | 38,041 | |
Other Family | 507 | 4,796 | 10,018 | |
Married w/Child | 775 | 10,412 | 19,074 | |
Single Male w/Child | 95 | 1,046 | 2,068 | |
Single Female w/Child | 123 | 1,191 | 2,834 |
Population Change Last Two Decades - Plus Projection
2000 | % | 2010 | % | 2020 | % | 2030 | |
---|---|---|---|---|---|---|---|
California | 33,871,648 | +10 | 37,253,956 | +9 | 40,467,295 | +8 | 43,631,295 |
Los Angeles County | 9,519,338 | +3 | 9,818,605 | +6 | 10,369,367 | +4 | 10,759,850 |
Total Working Age Population:
Total Households:
Total Working Age Population:
Total Households:
Total Working Age Population:
Total Households: