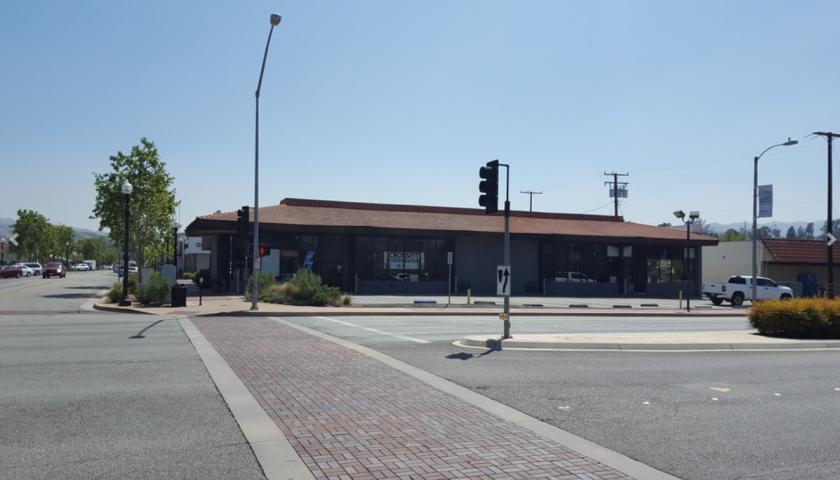
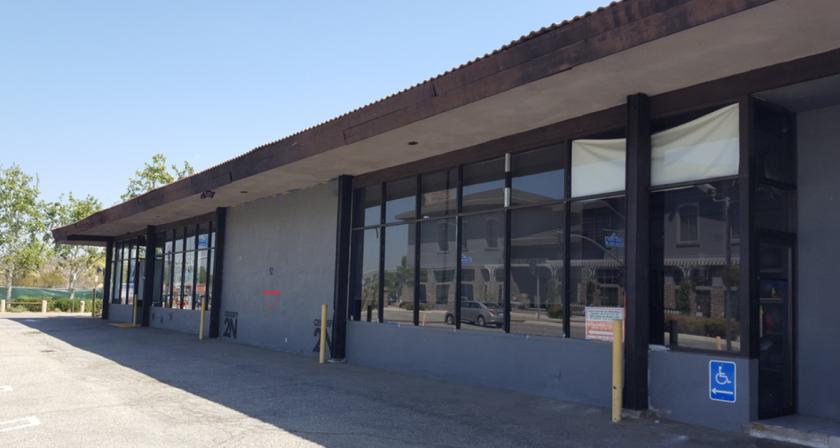
1-Mile | 3-Miles | 5-Miles | ||
---|---|---|---|---|
Total Population | 14,322 | 63,064 | 161,566 | |
Population Median Age | 34 | 38 | 37 | |
Population by Age | 0-9 Yrs | 2234 (15%) | 7948 (12%) | 21967 (13%) |
10-19 Yrs | 2593 (18%) | 8946 (14%) | 22927 (14%) | |
20-29 Yrs | 2107 (14%) | 8666 (13%) | 20901 (12%) | |
30-39 Yrs | 1955 (13%) | 7432 (11%) | 20520 (12%) | |
40-49 Yrs | 1591 (11%) | 8413 (13%) | 23368 (14%) | |
50-59 Yrs | 1834 (12%) | 9095 (14%) | 22479 (13%) | |
60-69 Yrs | 1013 (7%) | 6700 (10%) | 16229 (10%) | |
70+ Yrs | 996 (6%) | 5863 (9%) | 13177 (8%) | |
Median HH Income | $59,118 | $87,770 | $97,013 | |
Total Household Income | < 24K | 814 (19%) | 3039 (14%) | 5696 (10%) |
25-49K | 928 (22%) | 3356 (15%) | 7451 (13%) | |
50-74K | 690 (16%) | 2998 (13%) | 7622 (14%) | |
75-99K | 493 (11%) | 2626 (12%) | 6763 (12%) | |
100-199K | 917 (21%) | 6919 (32%) | 18393 (34%) | |
200K+ | 342 (8%) | 2531 (11%) | 7524 (14%) | |
Highest Education Level | No Diploma | 2295 | 5050 | 10623 |
Diploma or GED | 1785 | 7673 | 19020 | |
Some College | 1758 | 10884 | 26292 | |
Assoc. Degree | 717 | 3836 | 10596 | |
Bachelors Degree | 1376 | 9659 | 26699 | |
Higher Degree | 505 | 4756 | 13278 | |
Total Housing Units | 4,318 | 22,219 | 55,055 | |
--Owner-Occupied | 1,712 | 12,550 | 35,776 | |
--Renter-Occupied | 2,472 | 8,920 | 17,673 | |
Owner-Occupied Values | < 100K | 66 | 438 | 1335 |
100-199K | 24 | 356 | 1233 | |
200-299K | 114 | 596 | 1972 | |
300-399K | 154 | 1539 | 4271 | |
400-499K | 274 | 2532 | 7141 | |
500K+ | 1080 | 7090 | 19824 | |
Total Working Age Population | 10,615 | 49,954 | 125,768 | |
In Work Force | 7,311 | 32,314 | 84,314 | |
Not In Work Force | 3,304 | 17,640 | 41,454 | |
Workforce Employed | 6,865 | 30,513 | 79,979 | |
Workforce Unemployed | 445 | 1,754 | 4,272 | |
Civlian Workforce | 7,311 | 32,268 | 84,251 | |
Military Workforce | 0 | 46 | 62 | |
Total Households | 4,184 | 21,471 | 53,449 | |
Family Households | 3,015 | 15,109 | 39,379 | |
Non-Family Households | 1,169 | 6,361 | 14,070 | |
Married Couple | 2,201 | 11,615 | 30,606 | |
Other Family | 814 | 3,494 | 8,772 | |
Married w/Child | 1,128 | 5,184 | 14,797 | |
Single Male w/Child | 170 | 824 | 1,747 | |
Single Female w/Child | 305 | 923 | 2,515 |
Population Change Last Two Decades - Plus Projection
2000 | % | 2010 | % | 2020 | % | 2030 | |
---|---|---|---|---|---|---|---|
California | 33,871,648 | +10 | 37,253,956 | +9 | 40,467,295 | +8 | 43,631,295 |
Los Angeles County | 9,519,338 | +3 | 9,818,605 | +6 | 10,369,367 | +4 | 10,759,850 |
Total Working Age Population:
Total Households:
Total Working Age Population:
Total Households:
Total Working Age Population:
Total Households: