Commercial Land
19839 Soledad Canyon Road Santa Clarita, CA 91390
19839 Soledad Canyon Road Santa Clarita, CA 91390
Details & Description
Property Highlights
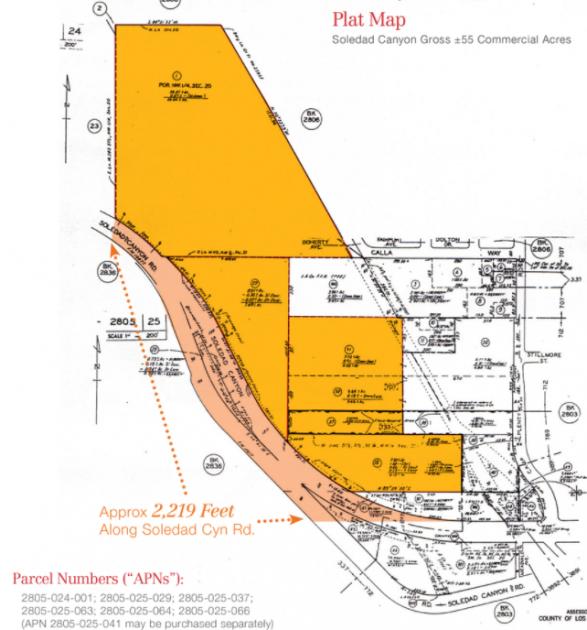
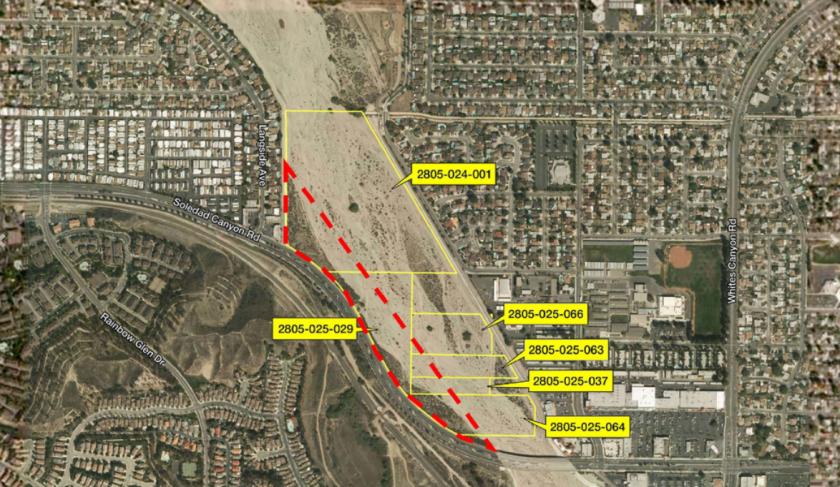
- • Gross acreage 55 acres
- • Zoning CN City of Santa Clarita
- • Traffic Counts Soledad Canyon Road 45,200 ADT
- • Sellers early estimate was a yield 20 Acres
Listing Agents

Bert Abel
O: 818-742-1652
M: 818-640-5276
babel@naicapital.com
O: 818-742-1652
M: 818-640-5276
babel@naicapital.com
While we strive to provide the most accurate information, all listing information, and demographic data, is provided by third-parties. As such, MyEListing will not be responsible for the accuracy of the information. It is strongly recommended that you verify all information with the listing agent, and any relevant agencies, prior to making any decisions.