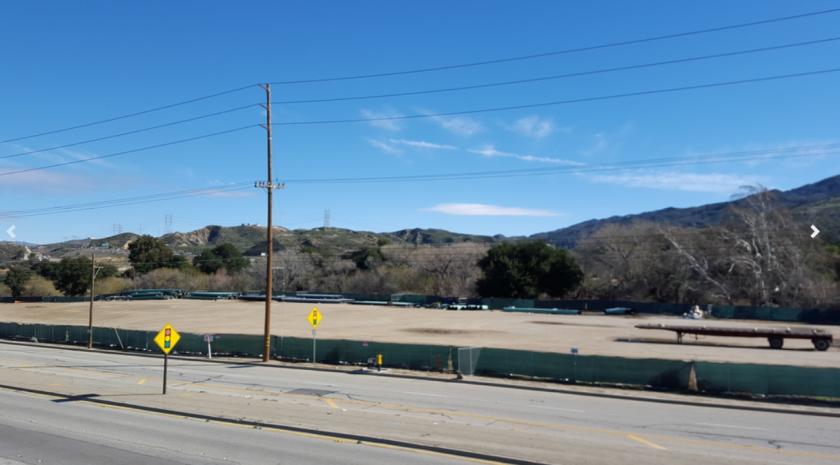
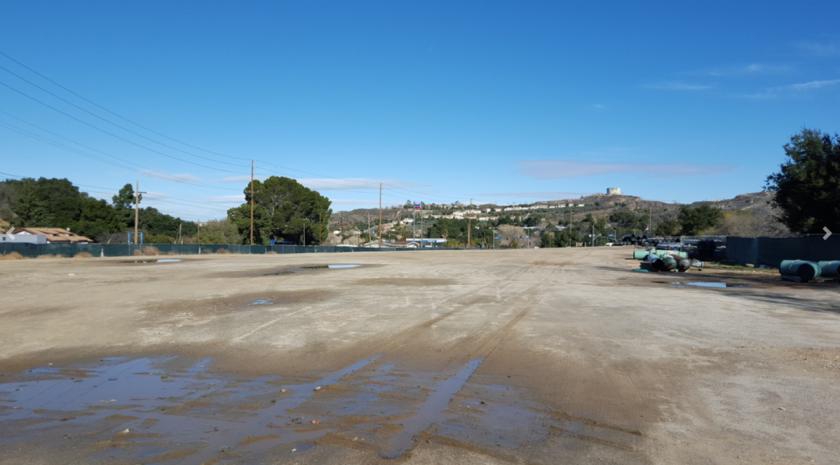
1-Mile | 3-Miles | 5-Miles | ||
---|---|---|---|---|
Total Population | 6,215 | 39,381 | 156,907 | |
Population Median Age | 33 | 36 | 37 | |
Population by Age | 0-9 Yrs | 688 (11%) | 5268 (13%) | 21219 (13%) |
10-19 Yrs | 1100 (17%) | 6021 (15%) | 22017 (14%) | |
20-29 Yrs | 1338 (21%) | 5876 (14%) | 20707 (13%) | |
30-39 Yrs | 870 (13%) | 4973 (12%) | 20299 (12%) | |
40-49 Yrs | 766 (12%) | 4801 (12%) | 21007 (13%) | |
50-59 Yrs | 770 (12%) | 5682 (14%) | 21438 (13%) | |
60-69 Yrs | 475 (7%) | 3618 (9%) | 16186 (10%) | |
70+ Yrs | 207 (3%) | 3142 (7%) | 14033 (8%) | |
Median HH Income | $64,917 | $83,471 | $85,687 | |
Total Household Income | < 24K | 318 (18%) | 1749 (14%) | 6255 (12%) |
25-49K | 376 (21%) | 1993 (16%) | 7974 (15%) | |
50-74K | 307 (17%) | 1835 (15%) | 8061 (15%) | |
75-99K | 223 (12%) | 1423 (11%) | 6839 (13%) | |
100-199K | 414 (23%) | 3773 (31%) | 15739 (31%) | |
200K+ | 118 (6%) | 1346 (11%) | 5560 (11%) | |
Highest Education Level | No Diploma | 1038 | 4276 | 15382 |
Diploma or GED | 751 | 5095 | 21427 | |
Some College | 860 | 6087 | 24837 | |
Assoc. Degree | 246 | 2251 | 9205 | |
Bachelors Degree | 545 | 5154 | 22387 | |
Higher Degree | 258 | 2257 | 10320 | |
Total Housing Units | 1,805 | 12,512 | 52,336 | |
--Owner-Occupied | 546 | 7,194 | 32,205 | |
--Renter-Occupied | 1,210 | 4,925 | 18,222 | |
Owner-Occupied Values | < 100K | 89 | 287 | 1685 |
100-199K | 38 | 171 | 1431 | |
200-299K | 58 | 517 | 2485 | |
300-399K | 68 | 671 | 4290 | |
400-499K | 62 | 1380 | 6254 | |
500K+ | 231 | 4168 | 16060 | |
Total Working Age Population | 4,870 | 30,673 | 122,592 | |
In Work Force | 3,508 | 20,601 | 80,595 | |
Not In Work Force | 1,362 | 10,072 | 41,997 | |
Workforce Employed | 3,301 | 19,471 | 76,469 | |
Workforce Unemployed | 207 | 1,124 | 4,041 | |
Civlian Workforce | 3,508 | 20,595 | 80,509 | |
Military Workforce | 0 | 6 | 86 | |
Total Households | 1,756 | 12,119 | 50,427 | |
Family Households | 1,281 | 9,134 | 36,953 | |
Non-Family Households | 476 | 2,985 | 13,474 | |
Married Couple | 790 | 6,803 | 27,407 | |
Other Family | 491 | 2,332 | 9,546 | |
Married w/Child | 425 | 3,152 | 12,535 | |
Single Male w/Child | 98 | 438 | 1,947 | |
Single Female w/Child | 138 | 696 | 2,661 |
Population Change Last Two Decades - Plus Projection
2000 | % | 2010 | % | 2020 | % | 2030 | |
---|---|---|---|---|---|---|---|
California | 33,871,648 | +10 | 37,253,956 | +9 | 40,467,295 | +8 | 43,631,295 |
Los Angeles County | 9,519,338 | +3 | 9,818,605 | +6 | 10,369,367 | +4 | 10,759,850 |
Total Working Age Population:
Total Households:
Total Working Age Population:
Total Households:
Total Working Age Population:
Total Households: