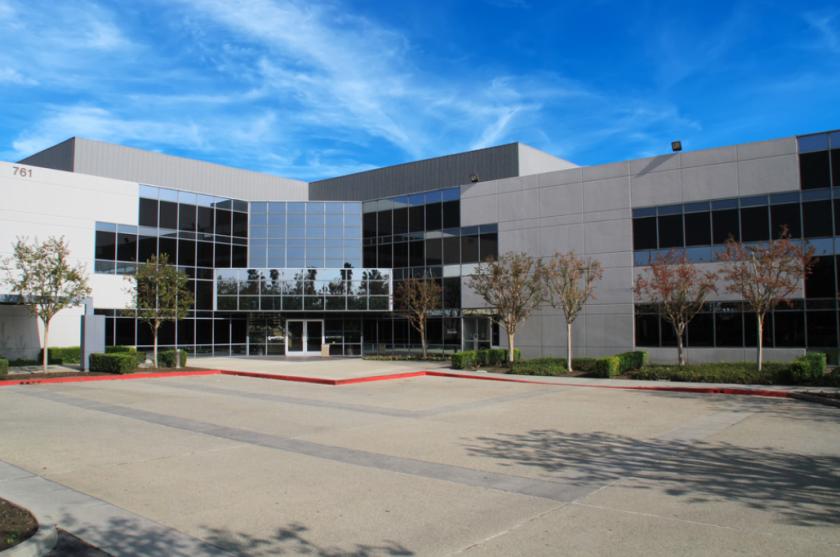
1-Mile | 3-Miles | 5-Miles | ||
---|---|---|---|---|
Total Population | 10,478 | 102,427 | 350,051 | |
Population Median Age | 34 | 37 | 38 | |
Population by Age | 0-9 Yrs | 1138 (10%) | 11877 (11%) | 42012 (12%) |
10-19 Yrs | 1858 (17%) | 16618 (16%) | 50164 (14%) | |
20-29 Yrs | 2555 (24%) | 16950 (16%) | 51317 (14%) | |
30-39 Yrs | 1080 (10%) | 12637 (12%) | 44449 (12%) | |
40-49 Yrs | 1268 (12%) | 11658 (11%) | 44287 (12%) | |
50-59 Yrs | 1142 (10%) | 13004 (12%) | 46762 (13%) | |
60-69 Yrs | 756 (7%) | 10747 (10%) | 38539 (11%) | |
70+ Yrs | 681 (6%) | 8936 (8%) | 32522 (9%) | |
Median HH Income | $63,873 | $71,004 | $75,450 | |
Total Household Income | < 24K | 287 (11%) | 4588 (16%) | 15721 (15%) |
25-49K | 720 (29%) | 5680 (20%) | 18432 (17%) | |
50-74K | 408 (16%) | 4457 (15%) | 16984 (16%) | |
75-99K | 382 (15%) | 3857 (13%) | 14048 (13%) | |
100-199K | 496 (20%) | 7299 (25%) | 28647 (27%) | |
200K+ | 167 (6%) | 2306 (8%) | 8949 (8%) | |
Highest Education Level | No Diploma | 1665 | 13721 | 42240 |
Diploma or GED | 1459 | 13530 | 48254 | |
Some College | 1243 | 13607 | 50673 | |
Assoc. Degree | 416 | 5309 | 19710 | |
Bachelors Degree | 864 | 12710 | 47715 | |
Higher Degree | 226 | 5807 | 23180 | |
Total Housing Units | 2,577 | 29,539 | 107,403 | |
--Owner-Occupied | 1,534 | 17,514 | 64,987 | |
--Renter-Occupied | 926 | 10,672 | 37,796 | |
Owner-Occupied Values | < 100K | 153 | 1163 | 4191 |
100-199K | 41 | 355 | 1607 | |
200-299K | 261 | 1374 | 3645 | |
300-399K | 384 | 2853 | 10036 | |
400-499K | 401 | 3198 | 11470 | |
500K+ | 294 | 8572 | 34038 | |
Total Working Age Population | 8,625 | 82,526 | 280,165 | |
In Work Force | 5,464 | 50,735 | 175,670 | |
Not In Work Force | 3,161 | 31,791 | 104,495 | |
Workforce Employed | 4,912 | 47,271 | 164,268 | |
Workforce Unemployed | 523 | 3,395 | 11,249 | |
Civlian Workforce | 5,435 | 50,666 | 175,518 | |
Military Workforce | 29 | 69 | 152 | |
Total Households | 2,460 | 28,187 | 102,783 | |
Family Households | 1,822 | 21,236 | 78,532 | |
Non-Family Households | 639 | 6,951 | 24,250 | |
Married Couple | 1,308 | 14,309 | 55,070 | |
Other Family | 514 | 6,927 | 23,462 | |
Married w/Child | 605 | 5,926 | 22,491 | |
Single Male w/Child | 65 | 877 | 2,722 | |
Single Female w/Child | 100 | 1,887 | 6,544 |
Population Change Last Two Decades - Plus Projection
2000 | % | 2010 | % | 2020 | % | 2030 | |
---|---|---|---|---|---|---|---|
California | 33,871,648 | +10 | 37,253,956 | +9 | 40,467,295 | +8 | 43,631,295 |
Los Angeles County | 9,519,338 | +3 | 9,818,605 | +6 | 10,369,367 | +4 | 10,759,850 |
San Bernardino County | 1,709,434 | +19 | 2,035,210 | +9 | 2,223,189 | +11 | 2,468,202 |
Total Working Age Population:
Total Households:
Total Working Age Population:
Total Households:
Total Working Age Population:
Total Households: