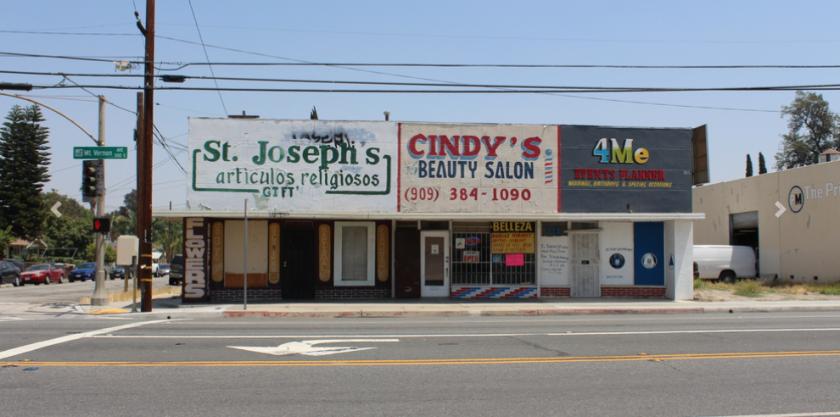
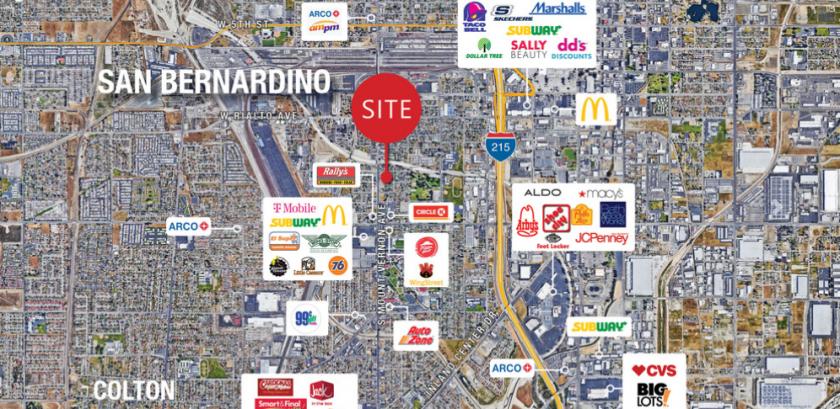
1-Mile | 3-Miles | 5-Miles | ||
---|---|---|---|---|
Total Population | 12,215 | 143,655 | 354,457 | |
Population Median Age | 31 | 33 | 33 | |
Population by Age | 0-9 Yrs | 2365 (19%) | 23721 (16%) | 57557 (16%) |
10-19 Yrs | 2248 (18%) | 24170 (16%) | 57588 (16%) | |
20-29 Yrs | 1790 (14%) | 24548 (17%) | 60762 (17%) | |
30-39 Yrs | 1795 (14%) | 20290 (14%) | 50464 (14%) | |
40-49 Yrs | 1320 (10%) | 16052 (11%) | 40766 (11%) | |
50-59 Yrs | 1146 (9%) | 15460 (10%) | 38438 (10%) | |
60-69 Yrs | 851 (6%) | 10495 (7%) | 27002 (7%) | |
70+ Yrs | 700 (5%) | 8920 (6%) | 21879 (6%) | |
Median HH Income | $40,284 | $43,108 | $48,523 | |
Total Household Income | < 24K | 1106 (33%) | 10718 (27%) | 24244 (24%) |
25-49K | 909 (27%) | 11501 (29%) | 26335 (26%) | |
50-74K | 564 (17%) | 7280 (18%) | 18973 (19%) | |
75-99K | 319 (9%) | 4699 (12%) | 12608 (12%) | |
100-199K | 370 (11%) | 4434 (11%) | 14398 (14%) | |
200K+ | 17 (0%) | 431 (1%) | 1783 (1%) | |
Highest Education Level | No Diploma | 2633 | 30422 | 65451 |
Diploma or GED | 1929 | 24595 | 61236 | |
Some College | 1256 | 16646 | 43977 | |
Assoc. Degree | 299 | 4422 | 12824 | |
Bachelors Degree | 425 | 5487 | 18113 | |
Higher Degree | 113 | 1933 | 8381 | |
Total Housing Units | 3,544 | 42,526 | 106,201 | |
--Owner-Occupied | 1,526 | 19,112 | 48,048 | |
--Renter-Occupied | 1,759 | 19,951 | 50,292 | |
Owner-Occupied Values | < 100K | 247 | 3216 | 5916 |
100-199K | 538 | 4538 | 8703 | |
200-299K | 582 | 7241 | 17801 | |
300-399K | 119 | 3204 | 11610 | |
400-499K | 21 | 624 | 2760 | |
500K+ | 19 | 288 | 1258 | |
Total Working Age Population | 8,412 | 104,876 | 262,160 | |
In Work Force | 4,807 | 61,447 | 158,856 | |
Not In Work Force | 3,605 | 43,429 | 103,304 | |
Workforce Employed | 4,380 | 55,894 | 143,531 | |
Workforce Unemployed | 427 | 5,512 | 15,185 | |
Civlian Workforce | 4,807 | 61,406 | 158,716 | |
Military Workforce | 0 | 41 | 140 | |
Total Households | 3,286 | 39,063 | 98,341 | |
Family Households | 2,661 | 30,531 | 75,467 | |
Non-Family Households | 625 | 8,532 | 22,874 | |
Married Couple | 1,369 | 17,026 | 43,945 | |
Other Family | 1,292 | 13,505 | 31,522 | |
Married w/Child | 655 | 8,483 | 21,112 | |
Single Male w/Child | 175 | 1,679 | 4,010 | |
Single Female w/Child | 599 | 5,278 | 12,368 |
Population Change Last Two Decades - Plus Projection
2000 | % | 2010 | % | 2020 | % | 2030 | |
---|---|---|---|---|---|---|---|
California | 33,871,648 | +10 | 37,253,956 | +9 | 40,467,295 | +8 | 43,631,295 |
Riverside County | 1,545,387 | +42 | 2,189,641 | +14 | 2,493,116 | +14 | 2,843,493 |
San Bernardino County | 1,709,434 | +19 | 2,035,210 | +9 | 2,223,189 | +11 | 2,468,202 |
Total Working Age Population:
Total Households:
Total Working Age Population:
Total Households:
Total Working Age Population:
Total Households: