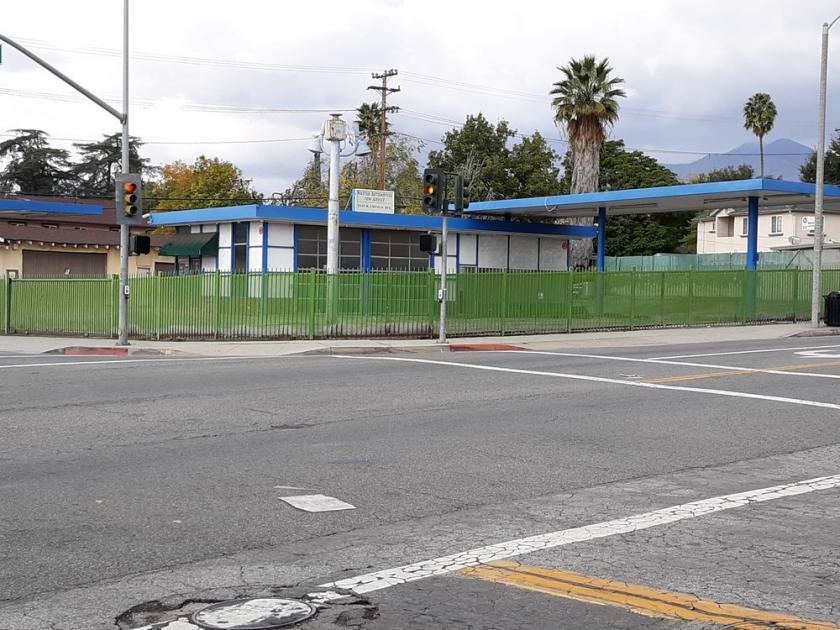
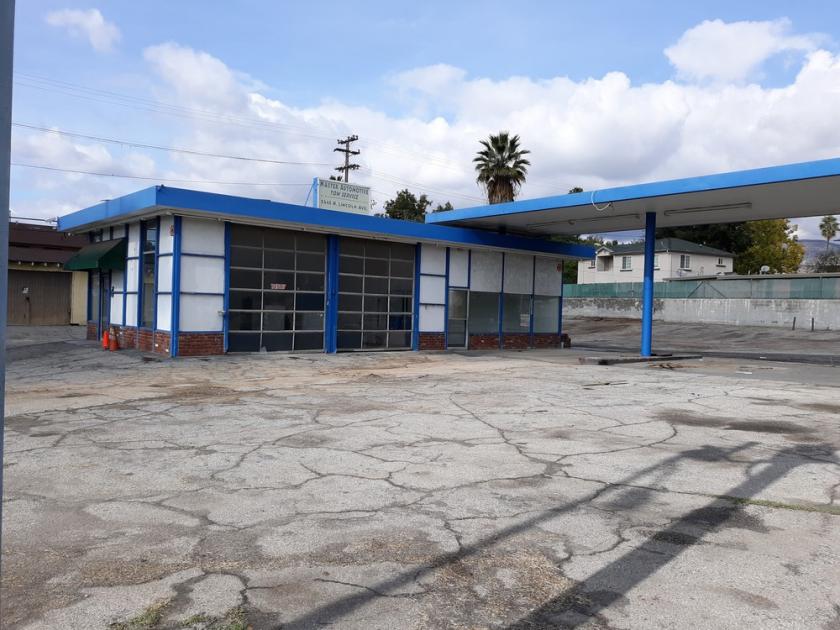
1-Mile | 3-Miles | 5-Miles | ||
---|---|---|---|---|
Total Population | 19,967 | 120,612 | 288,754 | |
Population Median Age | 39 | 40 | 40 | |
Population by Age | 0-9 Yrs | 2417 (12%) | 13883 (11%) | 31925 (11%) |
10-19 Yrs | 2299 (11%) | 13629 (11%) | 30420 (10%) | |
20-29 Yrs | 2655 (13%) | 15788 (13%) | 38159 (13%) | |
30-39 Yrs | 2729 (13%) | 15662 (12%) | 41245 (14%) | |
40-49 Yrs | 2933 (14%) | 17131 (14%) | 40928 (14%) | |
50-59 Yrs | 2604 (13%) | 17222 (14%) | 40106 (13%) | |
60-69 Yrs | 2129 (10%) | 13496 (11%) | 32626 (11%) | |
70+ Yrs | 2202 (11%) | 13800 (11%) | 33345 (11%) | |
Median HH Income | $76,747 | $83,649 | $91,236 | |
Total Household Income | < 24K | 1141 (19%) | 7743 (18%) | 16820 (15%) |
25-49K | 792 (13%) | 5544 (13%) | 13939 (13%) | |
50-74K | 985 (16%) | 5655 (13%) | 14475 (13%) | |
75-99K | 704 (11%) | 4493 (10%) | 12502 (11%) | |
100-199K | 1843 (31%) | 10494 (25%) | 30223 (28%) | |
200K+ | 470 (7%) | 7064 (17%) | 18748 (17%) | |
Highest Education Level | No Diploma | 2508 | 12859 | 21973 |
Diploma or GED | 3156 | 14333 | 29220 | |
Some College | 3165 | 15177 | 35597 | |
Assoc. Degree | 1006 | 5333 | 14510 | |
Bachelors Degree | 2416 | 20870 | 60358 | |
Higher Degree | 1749 | 17198 | 49678 | |
Total Housing Units | 6,406 | 44,192 | 116,727 | |
--Owner-Occupied | 3,911 | 22,433 | 55,914 | |
--Renter-Occupied | 2,023 | 18,559 | 50,794 | |
Owner-Occupied Values | < 100K | 35 | 257 | 640 |
100-199K | 17 | 119 | 300 | |
200-299K | 43 | 238 | 455 | |
300-399K | 383 | 842 | 2163 | |
400-499K | 468 | 1565 | 3506 | |
500K+ | 2964 | 19412 | 48850 | |
Total Working Age Population | 16,131 | 98,255 | 238,631 | |
In Work Force | 10,590 | 62,429 | 154,899 | |
Not In Work Force | 5,541 | 35,826 | 83,733 | |
Workforce Employed | 10,031 | 59,417 | 147,388 | |
Workforce Unemployed | 559 | 2,977 | 7,404 | |
Civlian Workforce | 10,590 | 62,394 | 154,792 | |
Military Workforce | 0 | 35 | 107 | |
Total Households | 5,934 | 40,992 | 106,708 | |
Family Households | 4,127 | 27,234 | 67,471 | |
Non-Family Households | 1,807 | 13,758 | 39,236 | |
Married Couple | 2,806 | 19,869 | 51,337 | |
Other Family | 1,321 | 7,365 | 16,135 | |
Married w/Child | 1,003 | 7,900 | 20,254 | |
Single Male w/Child | 79 | 708 | 1,745 | |
Single Female w/Child | 418 | 2,073 | 4,455 |
Population Change Last Two Decades - Plus Projection
2000 | % | 2010 | % | 2020 | % | 2030 | |
---|---|---|---|---|---|---|---|
California | 33,871,648 | +10 | 37,253,956 | +9 | 40,467,295 | +8 | 43,631,295 |
Los Angeles County | 9,519,338 | +3 | 9,818,605 | +6 | 10,369,367 | +4 | 10,759,850 |
Total Working Age Population:
Total Households:
Total Working Age Population:
Total Households:
Total Working Age Population:
Total Households: