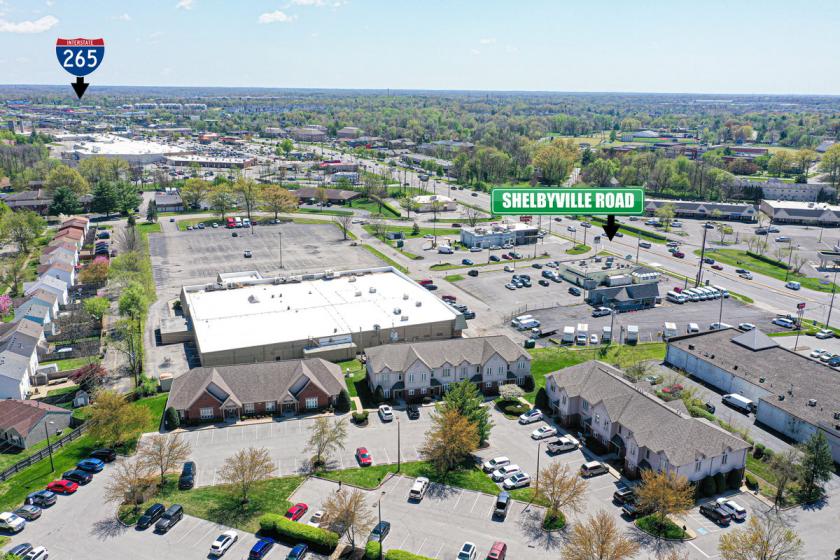
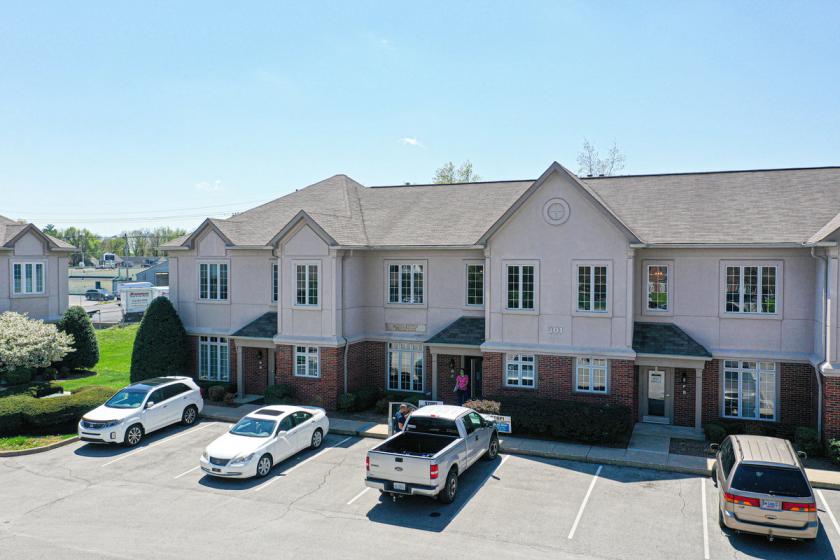
Highly functional 2nd floor Middletown Office Condos now available for Sale or Lease!
Built in 1995, these units in the heart of Middletown are located minutes from both I-265 and I-64 and just off Shelbyville Road. The currently layout is very efficient yet not over-built. A new user can plug and play very easily in the space. Offering includes the follow units and pricing:
303 Middletown Park Place - Units A-C: For Sale - $365,000 or For Lease $3,250 per month (net of utilities)
303 Middletown Park Place - Unit D (End Cap): For Sale $125,000 or For Lease $1,250 per month (net of utilities)
303 Middletown Park Place - Units A-D: For Sale $490,000 or For Lease $4,500 per month (net of utilities)
301 Middletown Park Place - Units G-H: For Sale $245,000 or For Lease $2,250 per month (net of utilities)
303 Middletown Park Place - Unit H: For Sale $115,000 or For Lease $1,150 per month (net of utilities)
Park Place offers:
+ Ample non-designated parking
+ Building Exterior Signage
+ Clean and bright common areas
+ Countless nearby amenities for food and shopping
Please contact Agents for additional information.
No part of this information may be copied, reproduced, repurposed, or screen-captured for any commercial purpose without prior written authorization from MyEListing.
While we strive to provide the most accurate information, all listing information, and demographic data, is provided by third-parties. As such, MyEListing will not be responsible for the accuracy of the information. It is strongly recommended that you verify all information with the listing agent, and any relevant agencies, prior to making any decisions.
What is the asking price for 301 Middletown Park Place in Louisville?
The asking price for 301 Middletown Park Place is $245,000
What is the building size of this Office property in Louisville, KY?
The size of the building/unit at 301 Middletown Park Place in Louisville is 2,210 square feet
How much land does the Louisville, KY property at 301 Middletown Park Place include?
301 Middletown Park Place in Louisville includes 1.000 acres of land
What kind of Office is the propery at 301 Middletown Park Place?
The property at 301 Middletown Park Place Louisville, KY 40243 is listed as a Professional Office property
What is the population within 1 mile of 301 Middletown Park Place in Louisville?
The population within 1 mile of 301 Middletown Park Place Louisville, KY 40243 is 4,766 people.
Who do I contact for questions about 301 Middletown Park Place?
You should contact the listing agent,
Woodford Hoagland, for any details regarding this commercial listing.