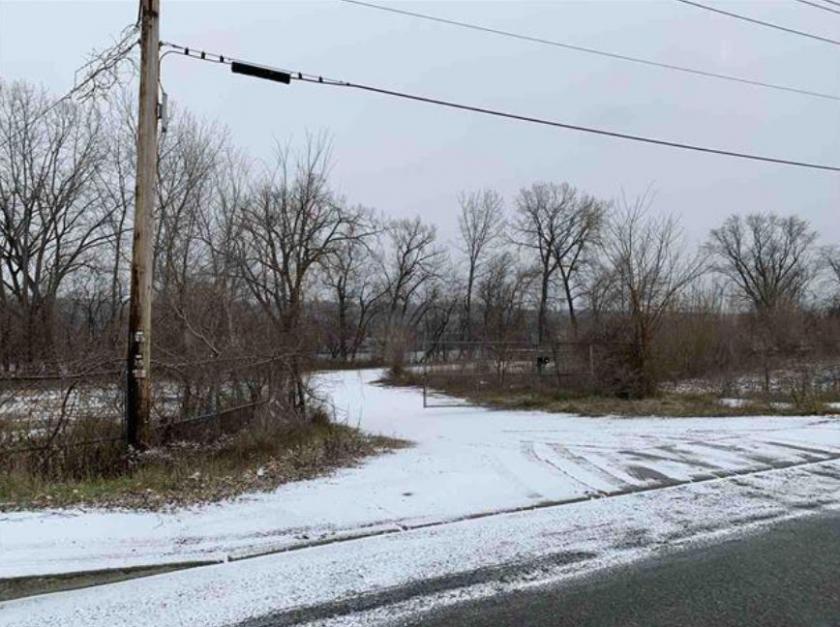
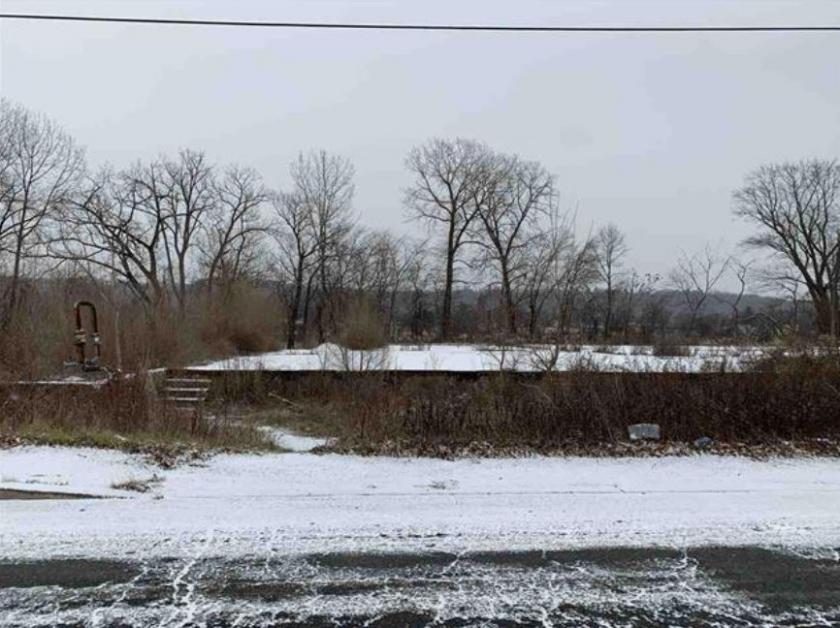
Commercial Land
50 Delaware Avenue Cohoes, NY 12047
50 Delaware Avenue Cohoes, NY 12047
Details & Description
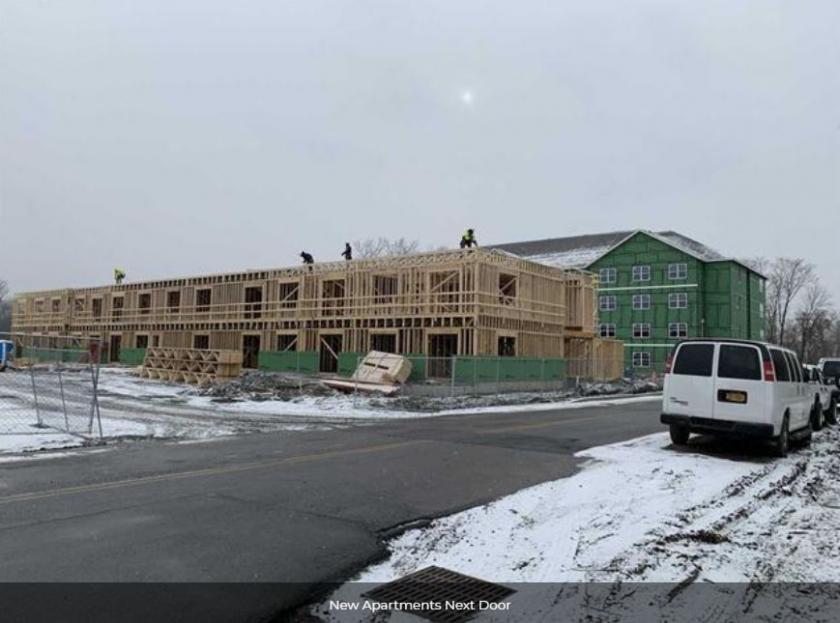
Additional Photos

Listing Agents

James Verro
O: 518-465-1400
M: 518-369-5048
jverro@ccim.net
O: 518-465-1400
M: 518-369-5048
jverro@ccim.net
While we strive to provide the most accurate information, all listing information, and demographic data, is provided by third-parties. As such, MyEListing will not be responsible for the accuracy of the information. It is strongly recommended that you verify all information with the listing agent, and any relevant agencies, prior to making any decisions.


