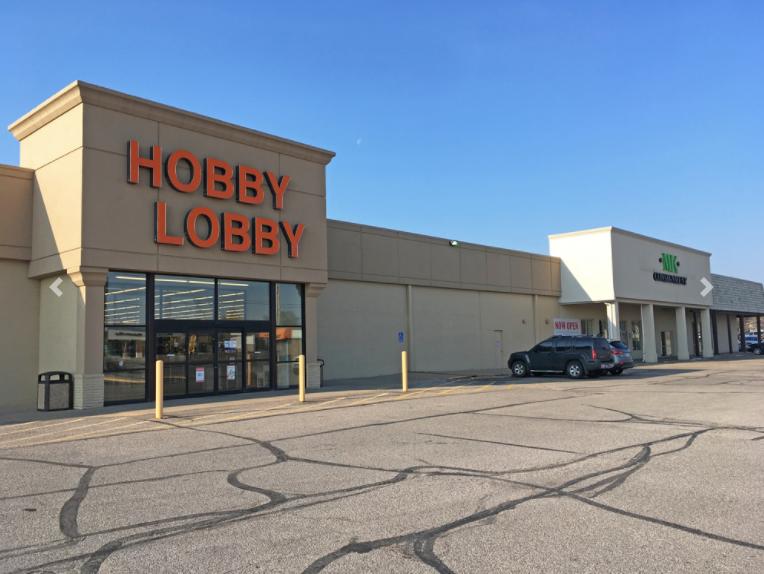
Retail Space
7020 West Central Avenue Wichita, KS 67212
7020 West Central Avenue Wichita, KS 67212
Details & Description
Property Highlights
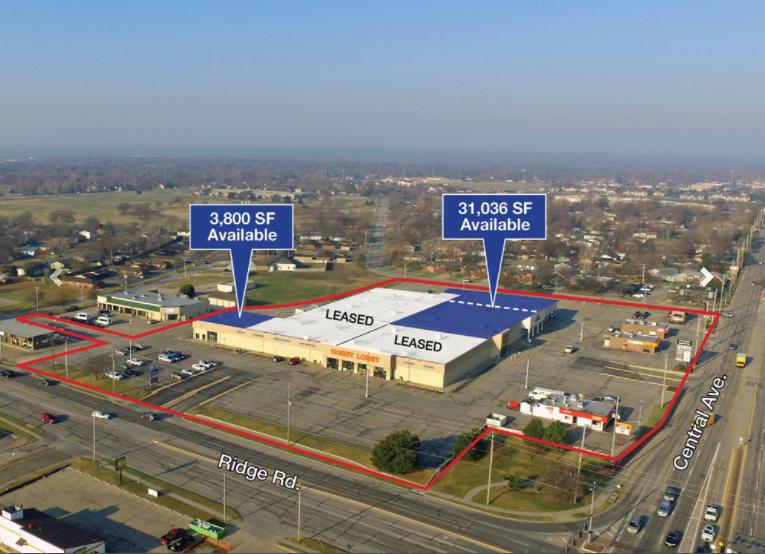
- • Two Suites Available
- • Year Built 1960
- • Site Area 8.6 Acres
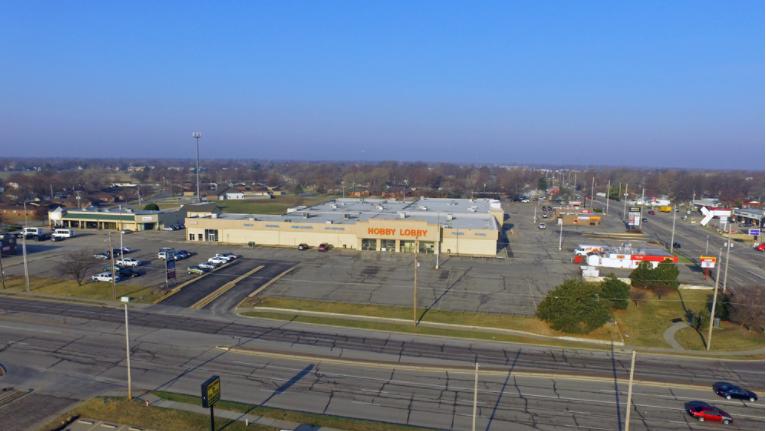
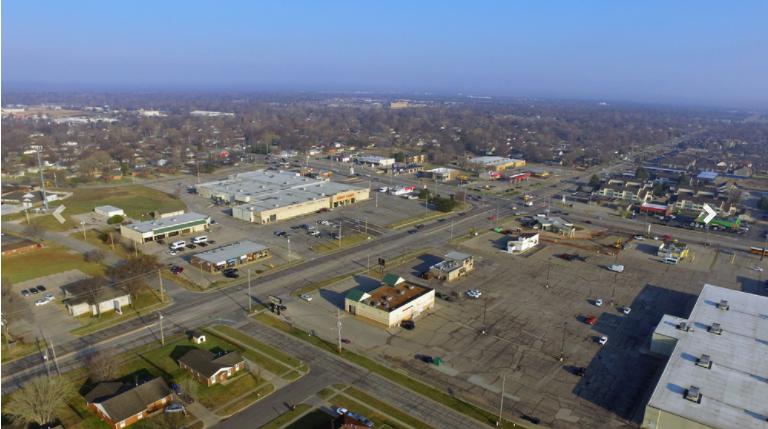
Additional Photos

Listing Agents

Troy Farha
O: 316-847-4904
M: 316-650-6555
tfarha@naimartens.com
O: 316-847-4904
M: 316-650-6555
tfarha@naimartens.com

Carl LaSala
O: 913-956-5805
M: 913-706-5076
carl@nai-heartland.com
O: 913-956-5805
M: 913-706-5076
carl@nai-heartland.com
While we strive to provide the most accurate information, all listing information, and demographic data, is provided by third-parties. As such, MyEListing will not be responsible for the accuracy of the information. It is strongly recommended that you verify all information with the listing agent, and any relevant agencies, prior to making any decisions.


