Commercial Land
664 East 10th Avenue Wellington, KS 67152
664 East 10th Avenue Wellington, KS 67152
Details & Description
Property Highlights
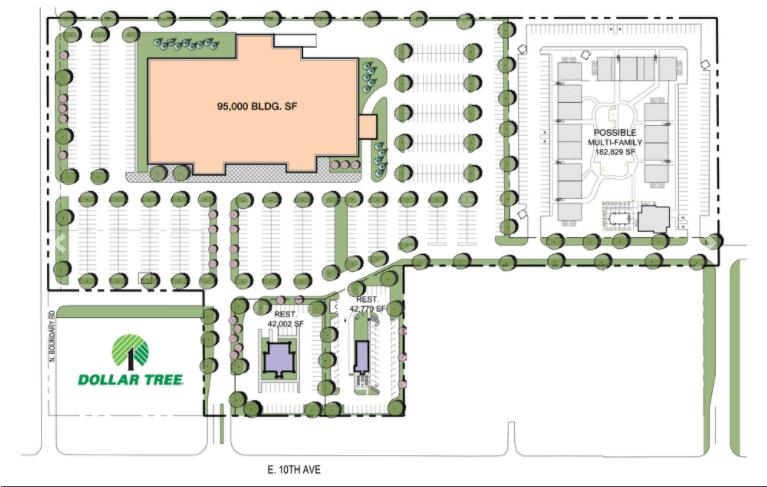
• 95,000 SF Retail Space
• 95,000 SF Retail Space
Listing Agents

Troy Farha
O: 316-847-4904
M: 316-650-6555
tfarha@naimartens.com
O: 316-847-4904
M: 316-650-6555
tfarha@naimartens.com

Nathan Farha
O: 316-263-9669
M: 316-807-3250
nfarha@naimartens.com
O: 316-263-9669
M: 316-807-3250
nfarha@naimartens.com
While we strive to provide the most accurate information, all listing information, and demographic data, is provided by third-parties. As such, MyEListing will not be responsible for the accuracy of the information. It is strongly recommended that you verify all information with the listing agent, and any relevant agencies, prior to making any decisions.


