Specialty Real Estate
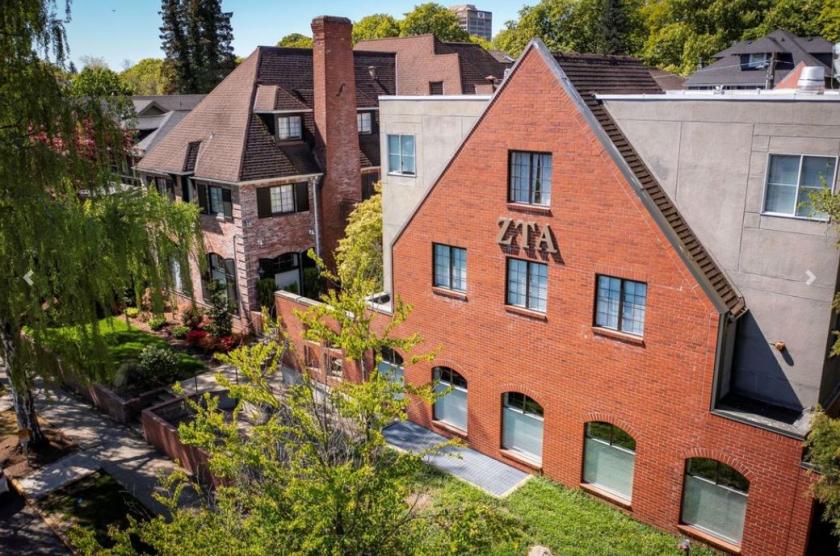
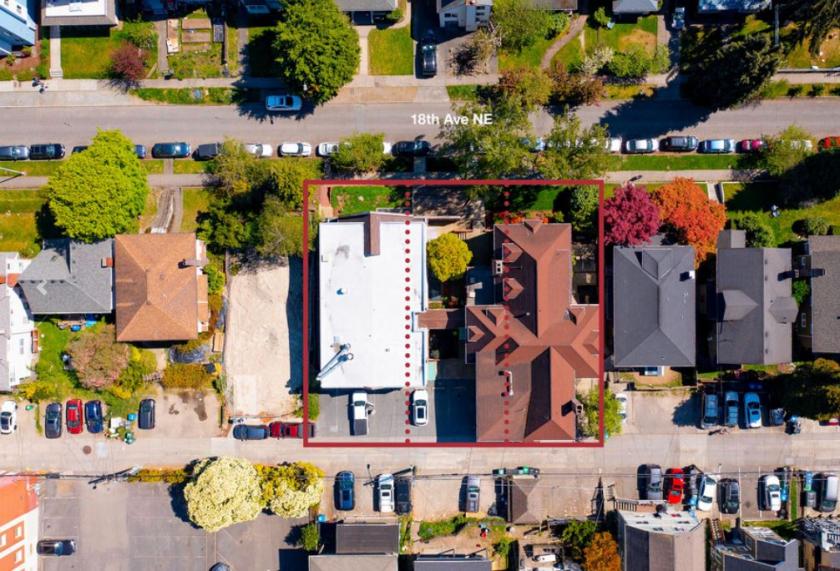
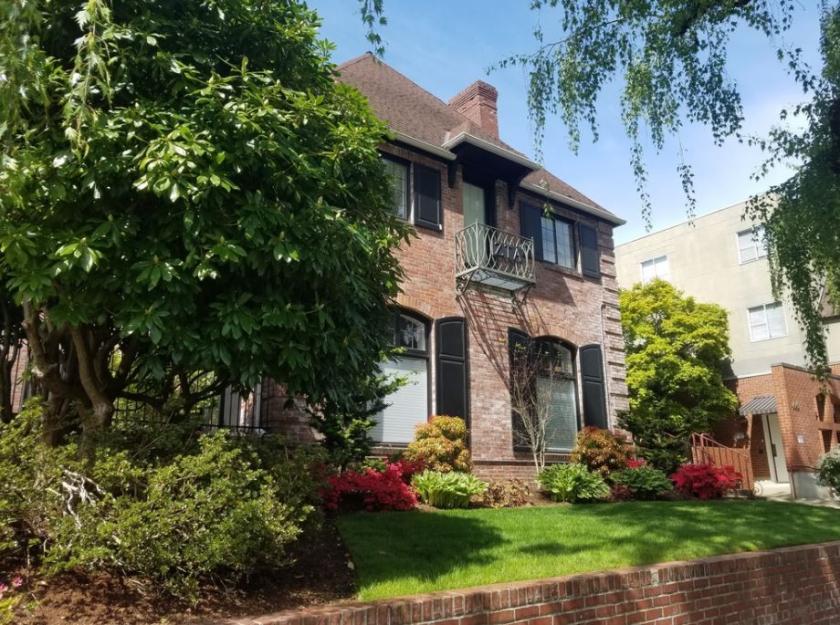
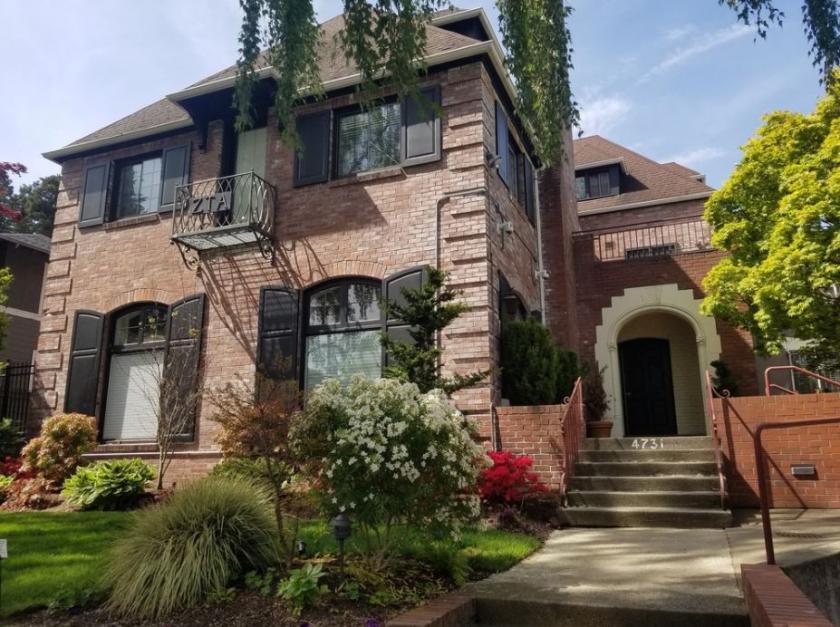
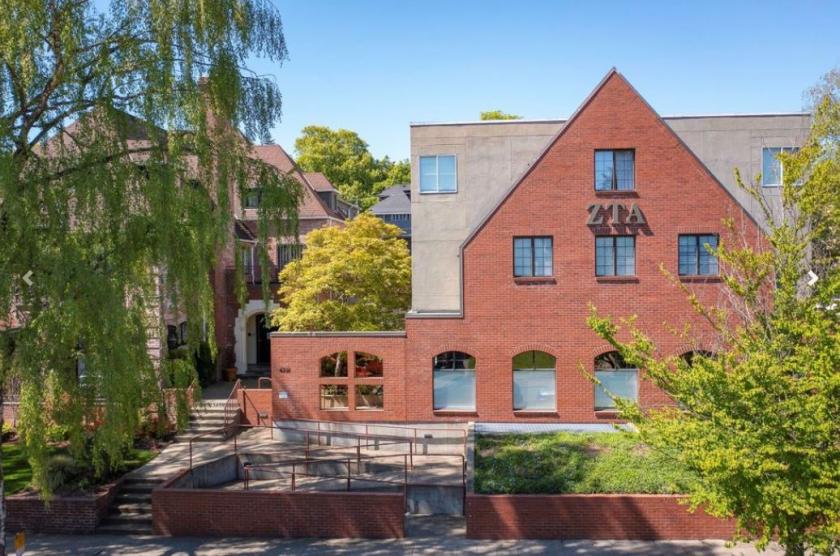
4737 18th Avenue Northeast Seattle, WA 98105
4737 18th Avenue Northeast Seattle, WA 98105
Details & Description
Additional Photos
Listing Agents

Kurt Sorensen
O: 206-332-1490
M: 206-817-5700
ksorensen@nai-psp.com
O: 206-332-1490
M: 206-817-5700
ksorensen@nai-psp.com

Andrew Graff
O: 206-332-1486
M: 425-218-3636
agraff@nai-psp.com
O: 206-332-1486
M: 425-218-3636
agraff@nai-psp.com

Kyle Graff
O: 206-332-1494
M: 425-290-2247
kgraff@nai-psp.com
O: 206-332-1494
M: 425-290-2247
kgraff@nai-psp.com
While we strive to provide the most accurate information, all listing information, and demographic data, is provided by third-parties. As such, MyEListing will not be responsible for the accuracy of the information. It is strongly recommended that you verify all information with the listing agent, and any relevant agencies, prior to making any decisions.


