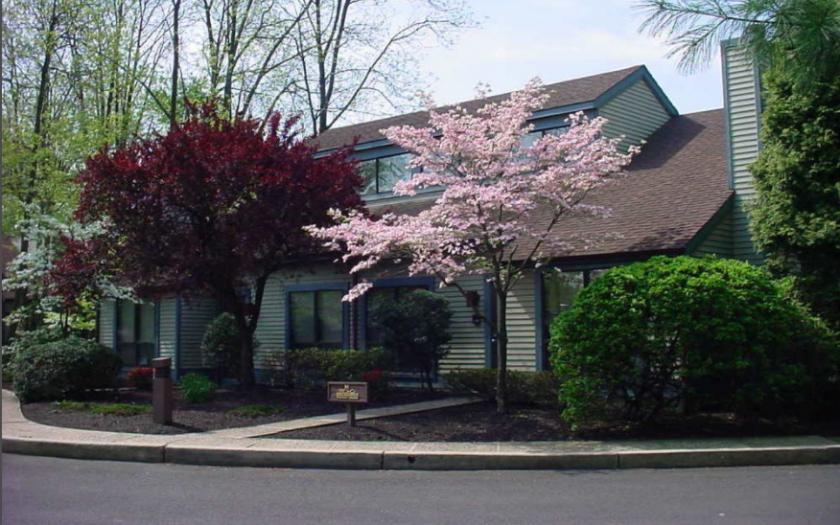
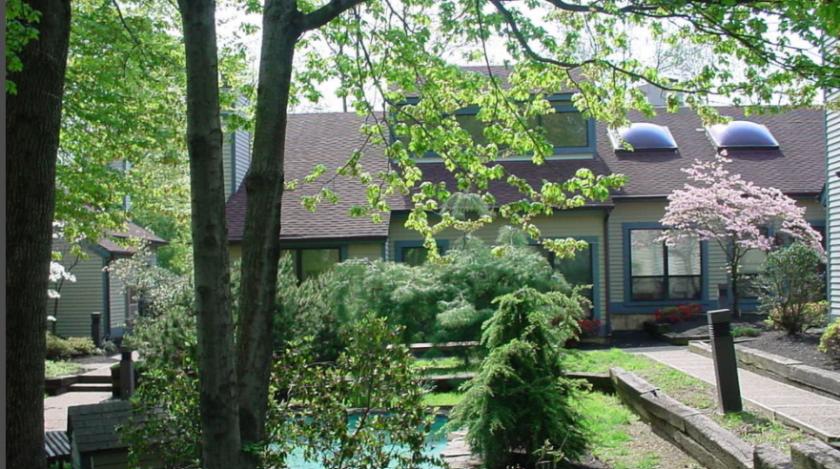
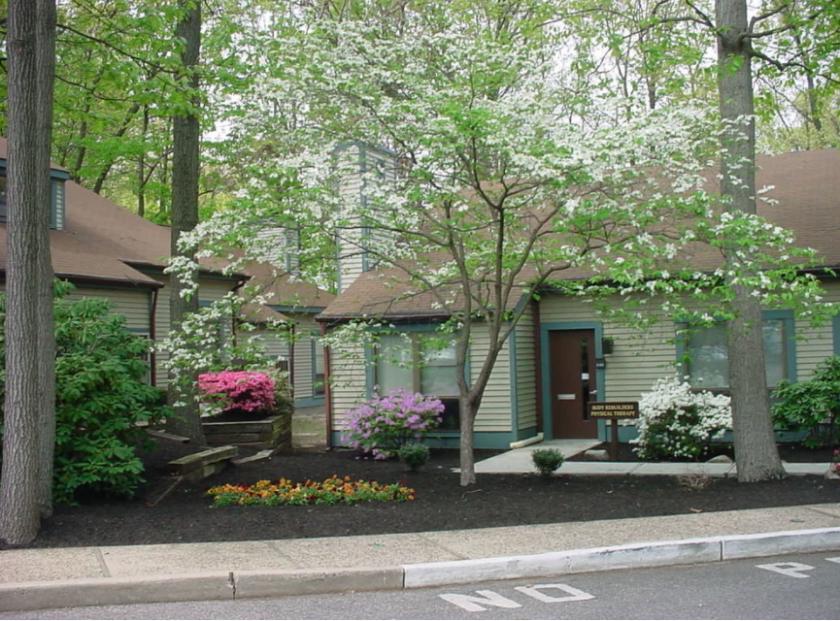
1-Mile | 3-Miles | 5-Miles | ||
---|---|---|---|---|
Total Population | 8,518 | 78,708 | 209,417 | |
Population Median Age | 41 | 42 | 42 | |
Population by Age | 0-9 Yrs | 881 (10%) | 8709 (11%) | 22469 (10%) |
10-19 Yrs | 1237 (14%) | 9097 (11%) | 24960 (11%) | |
20-29 Yrs | 849 (9%) | 8022 (10%) | 23165 (11%) | |
30-39 Yrs | 1014 (11%) | 9745 (12%) | 25605 (12%) | |
40-49 Yrs | 1185 (13%) | 10110 (12%) | 27985 (13%) | |
50-59 Yrs | 1248 (14%) | 11984 (15%) | 30952 (14%) | |
60-69 Yrs | 835 (9%) | 9392 (11%) | 24670 (11%) | |
70+ Yrs | 1270 (14%) | 11649 (14%) | 29612 (14%) | |
Median HH Income | $114,703 | $103,136 | $96,968 | |
Total Household Income | < 24K | 305 (9%) | 3292 (10%) | 9455 (11%) |
25-49K | 399 (12%) | 3943 (12%) | 11592 (14%) | |
50-74K | 388 (12%) | 3734 (12%) | 10805 (13%) | |
75-99K | 369 (11%) | 3866 (12%) | 10107 (12%) | |
100-199K | 1031 (32%) | 10077 (33%) | 25911 (31%) | |
200K+ | 687 (21%) | 5562 (18%) | 13598 (16%) | |
Highest Education Level | No Diploma | 323 | 3045 | 8148 |
Diploma or GED | 786 | 10501 | 31702 | |
Some College | 801 | 8109 | 24149 | |
Assoc. Degree | 284 | 3712 | 10359 | |
Bachelors Degree | 2027 | 18100 | 44523 | |
Higher Degree | 1702 | 13660 | 32092 | |
Total Housing Units | 3,401 | 32,525 | 87,492 | |
--Owner-Occupied | 2,388 | 22,470 | 58,956 | |
--Renter-Occupied | 792 | 8,004 | 22,512 | |
Owner-Occupied Values | < 100K | 74 | 658 | 2044 |
100-199K | 231 | 3008 | 10503 | |
200-299K | 832 | 8057 | 19814 | |
300-399K | 762 | 6979 | 14150 | |
400-499K | 365 | 2291 | 6037 | |
500K+ | 124 | 1476 | 6407 | |
Total Working Age Population | 6,843 | 64,330 | 171,317 | |
In Work Force | 4,499 | 42,600 | 113,994 | |
Not In Work Force | 2,344 | 21,730 | 57,323 | |
Workforce Employed | 4,337 | 40,853 | 108,916 | |
Workforce Unemployed | 162 | 1,631 | 4,805 | |
Civlian Workforce | 4,499 | 42,484 | 113,721 | |
Military Workforce | 0 | 116 | 273 | |
Total Households | 3,180 | 30,474 | 81,468 | |
Family Households | 2,338 | 20,764 | 54,636 | |
Non-Family Households | 842 | 9,710 | 26,832 | |
Married Couple | 1,929 | 17,153 | 44,357 | |
Other Family | 409 | 3,611 | 10,279 | |
Married w/Child | 897 | 7,051 | 18,214 | |
Single Male w/Child | 74 | 585 | 1,556 | |
Single Female w/Child | 100 | 953 | 2,972 |
Population Change Last Two Decades - Plus Projection
2000 | % | 2010 | % | 2020 | % | 2030 | |
---|---|---|---|---|---|---|---|
New Jersey | 8,414,350 | +4 | 8,791,894 | +4 | 9,132,700 | +4 | 9,530,900 |
Burlington County | 423,394 | +6 | 448,734 | 0 | 450,000 | +3 | 464,900 |
Camden County | 508,932 | +1 | 513,657 | 0 | 511,800 | +2 | 521,000 |
Gloucester County | 254,673 | +13 | 288,288 | +1 | 292,000 | +5 | 305,800 |
Pennsylvania | 12,281,054 | +3 | 12,702,379 | +4 | 13,230,170 | +4 | 13,759,594 |
Philadelphia County | 1,517,550 | +1 | 1,526,006 | +8 | 1,653,729 | +6 | 1,753,054 |
Total Working Age Population:
Total Households:
Total Working Age Population:
Total Households:
Total Working Age Population:
Total Households: