Suite 300 - 4,118 RSF (divisible to 800 RSF or 3,318 RSF)
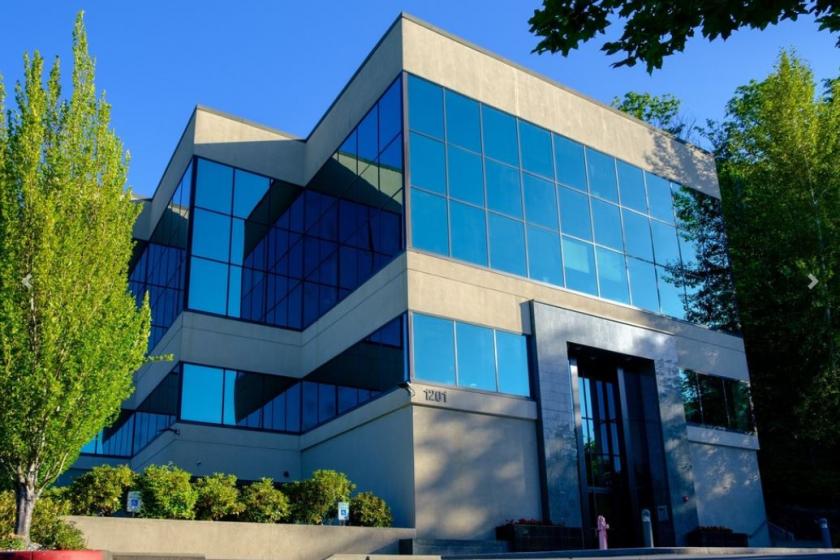
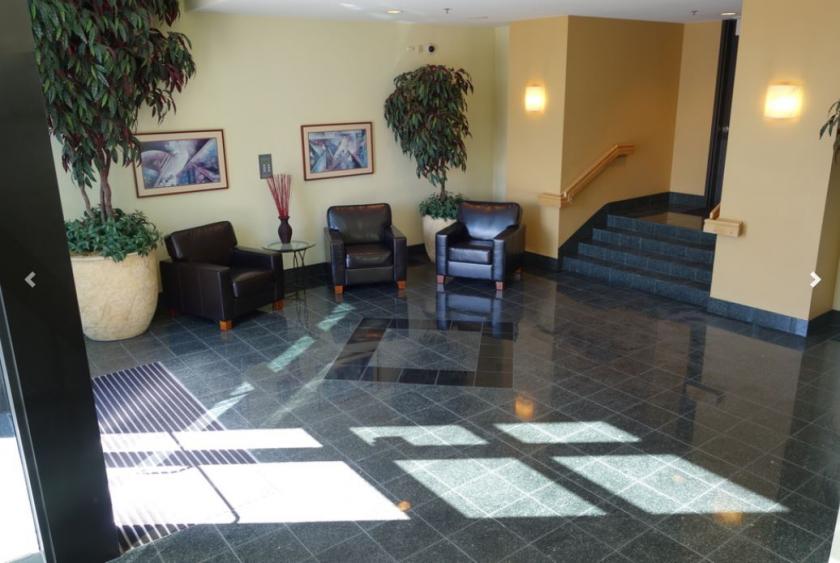
High quality, professional office building with Class-A finishes
On-site property management
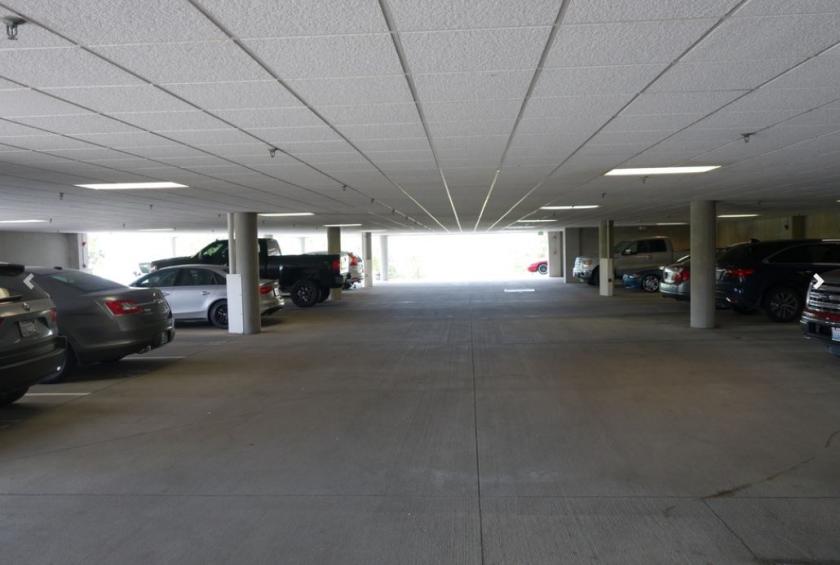
Reserved, covered parking available
Excellent access to I-405 and I-5, freeway visible location
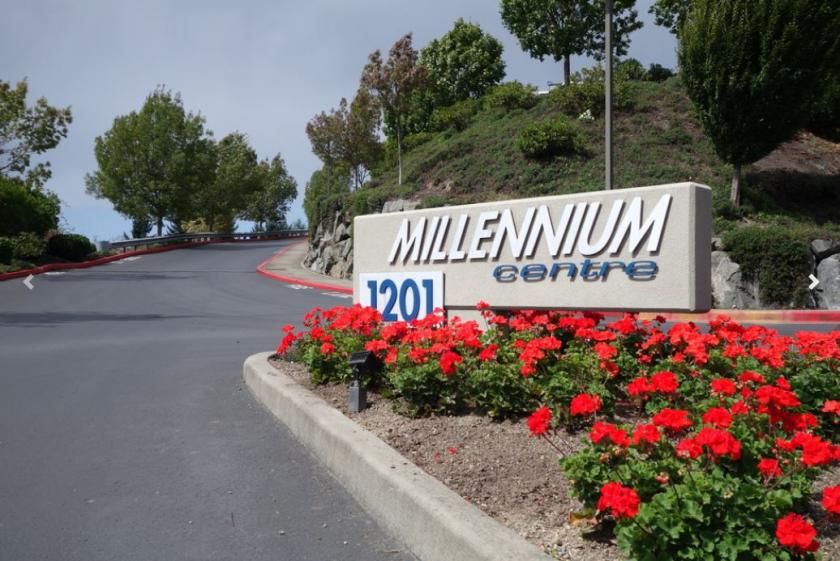
Conveniently located close to Westfield Southcenter Mall, downtown Renton, and SeaTac Airport
Short 15-minute walk to Tukwila Sounder station (0.7 miles away), hotels and other services
Move-in condition, with new carpet and paint
Fiber internet available
Rental Rate: $25.50/sf, Full Service
No part of this information may be copied, reproduced, repurposed, or screen-captured for any commercial purpose without prior written authorization from MyEListing.
While we strive to provide the most accurate information, all listing information, and demographic data, is provided by third-parties. As such, MyEListing will not be responsible for the accuracy of the information. It is strongly recommended that you verify all information with the listing agent, and any relevant agencies, prior to making any decisions.
What is the asking price for 1201 Monster Road Southwest in Renton?
The asking price for 1201 Monster Road Southwest is $25.50 a SF per Year
What is the building size of this commercial Office property?
The size of this multi-unit property varies between 800 - 4118 square feet
What kind of Office is the propery at 1201 Monster Road Southwest?
The property at 1201 Monster Road Southwest Renton, WA 98057 is listed as a Professional Office property
What is the population within 1 mile of 1201 Monster Road Southwest in Renton?
The population within 1 mile of 1201 Monster Road Southwest Renton, WA 98057 is 8,128 people.
Who do I contact for questions about 1201 Monster Road Southwest?
You should contact the listing agent,
Scott Sulman, for any details regarding this commercial listing.