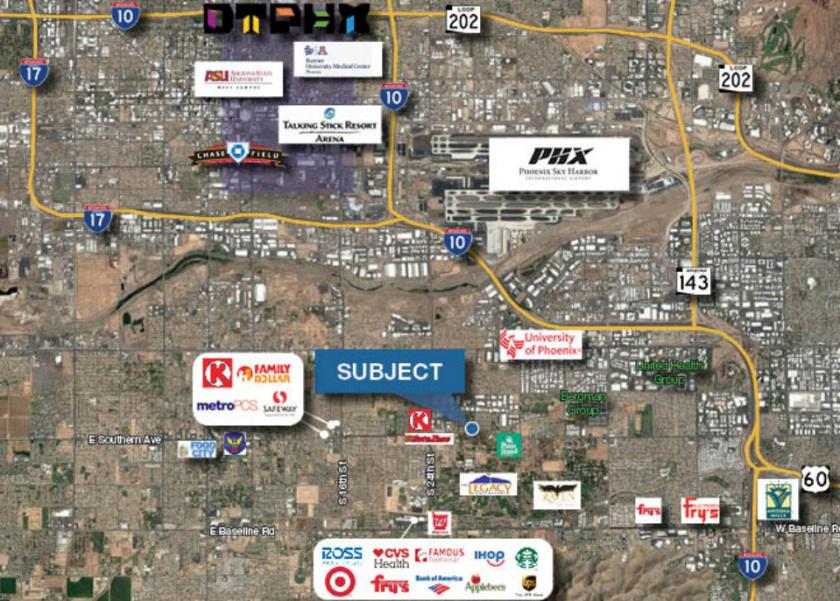
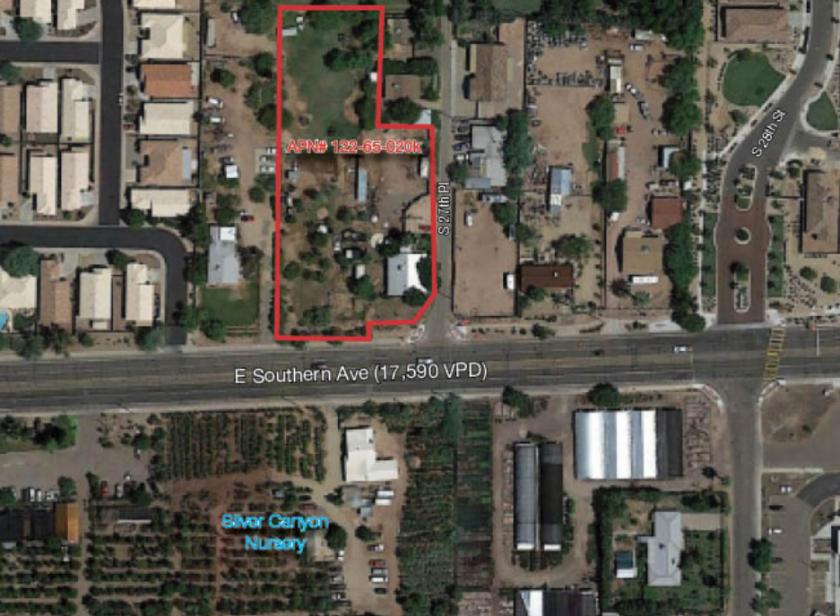
1-Mile | 3-Miles | 5-Miles | ||
---|---|---|---|---|
Total Population | 12,408 | 78,767 | 246,968 | |
Population Median Age | 33 | 34 | 34 | |
Population by Age | 0-9 Yrs | 1879 (15%) | 11750 (14%) | 35186 (14%) |
10-19 Yrs | 2155 (17%) | 12731 (16%) | 35329 (14%) | |
20-29 Yrs | 1958 (15%) | 12748 (16%) | 49227 (19%) | |
30-39 Yrs | 1631 (13%) | 10626 (13%) | 37208 (15%) | |
40-49 Yrs | 1945 (15%) | 10934 (13%) | 29336 (11%) | |
50-59 Yrs | 1310 (10%) | 8679 (11%) | 25855 (10%) | |
60-69 Yrs | 806 (6%) | 6204 (7%) | 20063 (8%) | |
70+ Yrs | 723 (5%) | 5096 (6%) | 14766 (5%) | |
Median HH Income | $51,327 | $51,968 | $49,915 | |
Total Household Income | < 24K | 873 (22%) | 5395 (22%) | 20801 (24%) |
25-49K | 983 (25%) | 6394 (26%) | 21443 (25%) | |
50-74K | 746 (19%) | 4883 (19%) | 16571 (19%) | |
75-99K | 443 (11%) | 3199 (13%) | 9953 (11%) | |
100-199K | 667 (17%) | 3909 (15%) | 12713 (15%) | |
200K+ | 101 (2%) | 710 (2%) | 2880 (3%) | |
Highest Education Level | No Diploma | 1591 | 11430 | 33904 |
Diploma or GED | 2371 | 14171 | 37296 | |
Some College | 1623 | 10263 | 33196 | |
Assoc. Degree | 397 | 3845 | 10730 | |
Bachelors Degree | 940 | 5700 | 23204 | |
Higher Degree | 410 | 2943 | 13720 | |
Total Housing Units | 4,313 | 26,795 | 93,346 | |
--Owner-Occupied | 1,980 | 12,958 | 36,824 | |
--Renter-Occupied | 1,832 | 11,533 | 47,537 | |
Owner-Occupied Values | < 100K | 475 | 3069 | 7228 |
100-199K | 716 | 4867 | 12409 | |
200-299K | 555 | 2909 | 10470 | |
300-399K | 187 | 1452 | 4087 | |
400-499K | 23 | 202 | 989 | |
500K+ | 26 | 459 | 1641 | |
Total Working Age Population | 9,283 | 59,169 | 190,811 | |
In Work Force | 6,045 | 39,060 | 128,034 | |
Not In Work Force | 3,238 | 20,109 | 62,777 | |
Workforce Employed | 5,799 | 36,191 | 120,456 | |
Workforce Unemployed | 247 | 2,861 | 7,505 | |
Civlian Workforce | 6,045 | 39,051 | 127,961 | |
Military Workforce | 0 | 9 | 73 | |
Total Households | 3,812 | 24,491 | 84,361 | |
Family Households | 2,604 | 16,859 | 50,921 | |
Non-Family Households | 1,208 | 7,632 | 33,440 | |
Married Couple | 1,418 | 9,501 | 28,451 | |
Other Family | 1,186 | 7,358 | 22,470 | |
Married w/Child | 717 | 4,414 | 12,536 | |
Single Male w/Child | 84 | 846 | 2,460 | |
Single Female w/Child | 459 | 2,756 | 8,341 |
Population Change Last Two Decades - Plus Projection
2000 | % | 2010 | % | 2020 | % | 2030 | |
---|---|---|---|---|---|---|---|
Arizona | 5,130,632 | +25 | 6,392,017 | +14 | 7,286,100 | +14 | 8,284,900 |
Maricopa County | 3,072,149 | +24 | 3,817,117 | +16 | 4,436,900 | +15 | 5,107,700 |
Pinal County | 179,727 | +109 | 375,770 | +24 | 466,200 | +32 | 616,200 |
Total Working Age Population:
Total Households:
Total Working Age Population:
Total Households:
Total Working Age Population:
Total Households: