Suite 1715 - 2,601 SF available
Sublease term to 43022
Stable ownership
On-site restaurant
Valet parking for tenants visitors
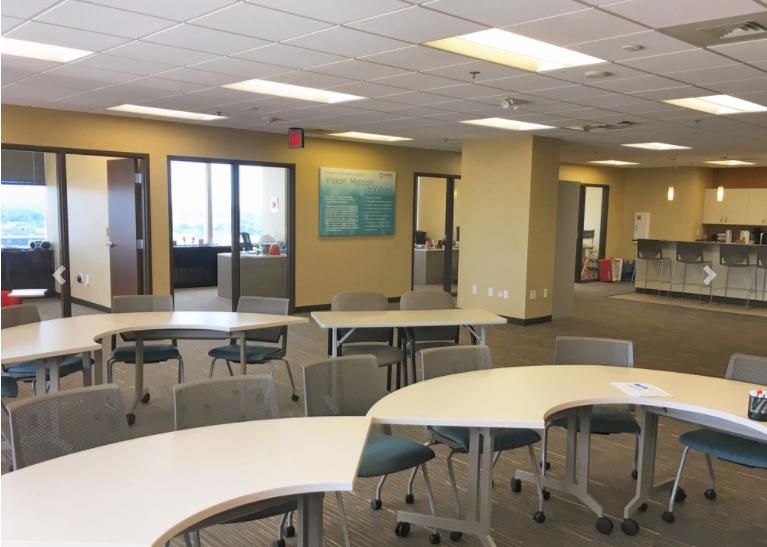
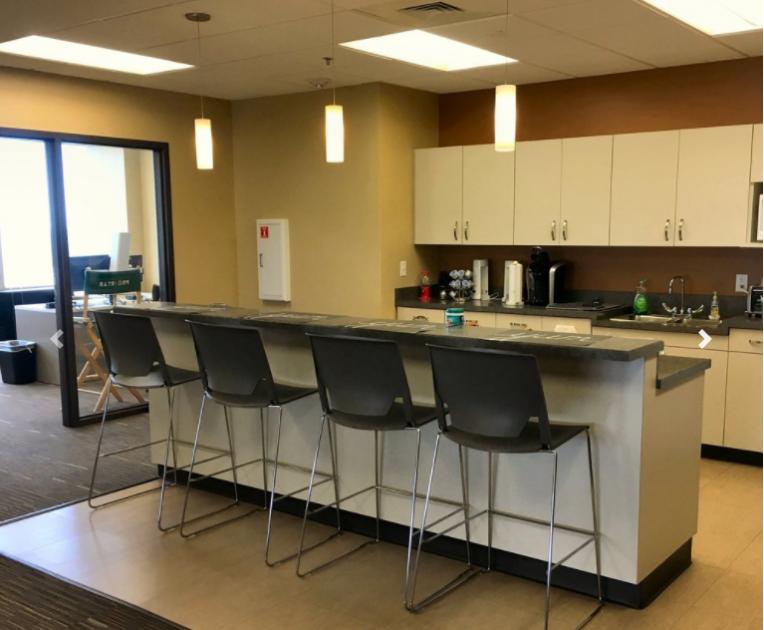
Downtown Wichita high-rise office building for sublease, with 2,601 SF available on the 17th floor. 125 N. Market is located within walking distance to various downtown amenities and has undergone numerous major upgrades.
Within walking distance to the $27 million, 111,000 SF Robert D. Love YMCA fitness facility, the $23 million, 117-room upscale Ambassador Hotel, the 15,000-seat INTRUST Bank Arena and Old Town entertainment district
Excellent data connectivity
Common conference room with wireless presentation capabilities
New, on-site professional management team
Elevator modernization with additional garage access
Chiller & boiler replacement
Common area renovation (floors 11,12,14,17)
Construction of (2) spec suites to facilitate in leasing and representation a new building standard finishes
Complete roof replacement
Garage renovation
Skywalk interior repair/façade & roof replacement
New building signage
No part of this information may be copied, reproduced, repurposed, or screen-captured for any commercial purpose without prior written authorization from MyEListing.
While we strive to provide the most accurate information, all listing information, and demographic data, is provided by third-parties. As such, MyEListing will not be responsible for the accuracy of the information. It is strongly recommended that you verify all information with the listing agent, and any relevant agencies, prior to making any decisions.
What is the asking price for 125 North Market Street in Wichita?
The asking price for 125 North Market Street is $9.00 a SF per Year
What is the building size of this commercial Office property?
The size of this lease property at '.125 North Market Street.' is 2601 square feet
What kind of Office is the propery at 125 North Market Street?
The property at 125 North Market Street Wichita, KS 67202 is listed as a Professional Office property
What is the population within 1 mile of 125 North Market Street in Wichita?
The population within 1 mile of 125 North Market Street Wichita, KS 67202 is 9,549 people.
Who do I contact for questions about 125 North Market Street?
You should contact the listing agent,
Patrick Ahern, for any details regarding this commercial listing.