Office Space
1330 East Douglas Avenue Wichita, KS 67214
1330 East Douglas Avenue Wichita, KS 67214

Details & Description
Property Highlights
- • Signage along Douglas available
- • Reserved employee and visitor parking
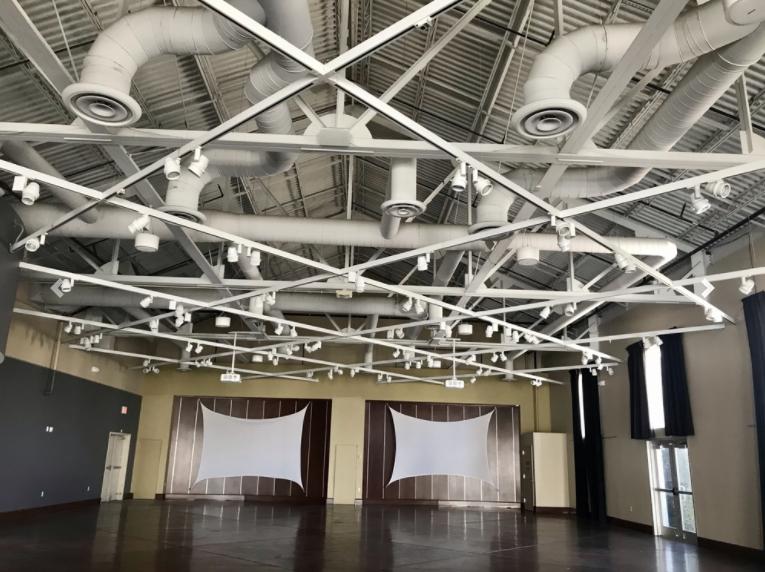
- • 16 ceiling heights
Listing Agents

Patrick Ahern
O: 316-847-4914
M: 316-253-0660
pahern@naimartens.com
O: 316-847-4914
M: 316-253-0660
pahern@naimartens.com
While we strive to provide the most accurate information, all listing information, and demographic data, is provided by third-parties. As such, MyEListing will not be responsible for the accuracy of the information. It is strongly recommended that you verify all information with the listing agent, and any relevant agencies, prior to making any decisions.