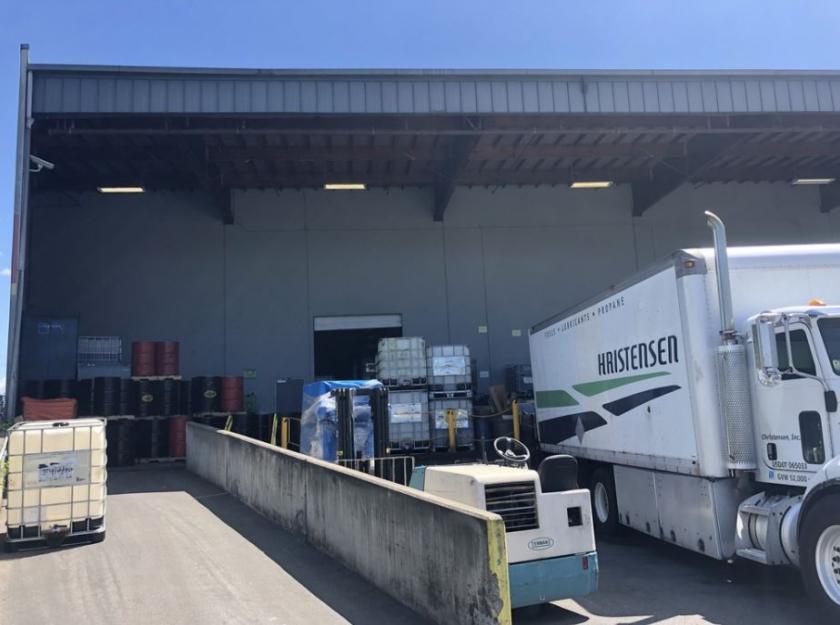
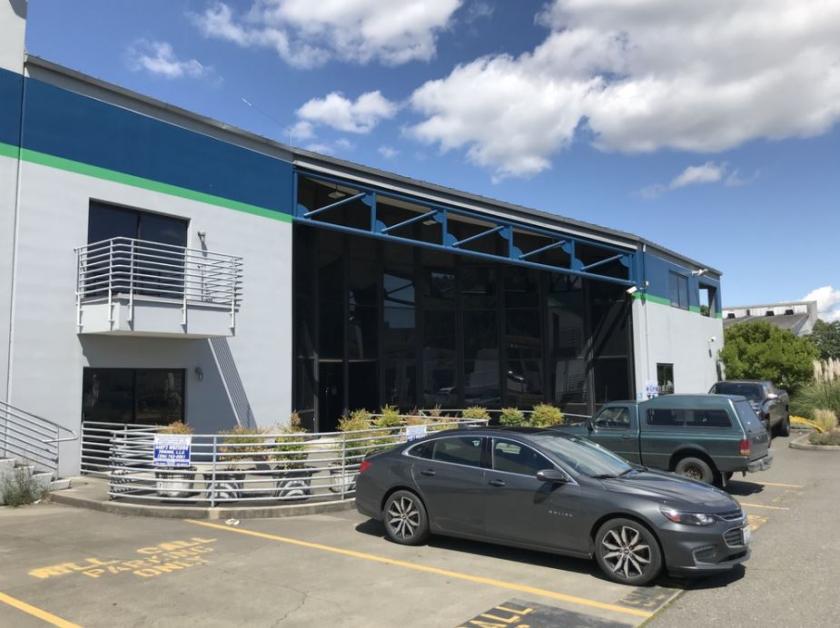
1-Mile | 3-Miles | 5-Miles | ||
---|---|---|---|---|
Total Population | 8,892 | 145,722 | 345,845 | |
Population Median Age | 41 | 38 | 40 | |
Population by Age | 0-9 Yrs | 977 (10%) | 18051 (12%) | 40085 (11%) |
10-19 Yrs | 848 (9%) | 14255 (9%) | 33234 (9%) | |
20-29 Yrs | 1026 (11%) | 20246 (13%) | 43625 (12%) | |
30-39 Yrs | 1315 (14%) | 24462 (16%) | 57882 (16%) | |
40-49 Yrs | 1232 (13%) | 21565 (14%) | 52233 (15%) | |
50-59 Yrs | 1342 (15%) | 19464 (13%) | 47759 (13%) | |
60-69 Yrs | 1141 (12%) | 15181 (10%) | 38420 (11%) | |
70+ Yrs | 1012 (11%) | 12500 (8%) | 32607 (9%) | |
Median HH Income | $52,444 | $75,931 | $85,536 | |
Total Household Income | < 24K | 887 (21%) | 9268 (16%) | 20772 (14%) |
25-49K | 1091 (26%) | 10628 (18%) | 23424 (16%) | |
50-74K | 621 (15%) | 8583 (14%) | 19398 (13%) | |
75-99K | 403 (9%) | 6875 (11%) | 15408 (10%) | |
100-199K | 876 (21%) | 16273 (28%) | 40089 (28%) | |
200K+ | 245 (5%) | 5844 (10%) | 21088 (15%) | |
Highest Education Level | No Diploma | 818 | 14851 | 29846 |
Diploma or GED | 1376 | 20880 | 42929 | |
Some College | 1686 | 19836 | 45676 | |
Assoc. Degree | 548 | 8482 | 19585 | |
Bachelors Degree | 1583 | 27158 | 72361 | |
Higher Degree | 792 | 14908 | 46922 | |
Total Housing Units | 4,360 | 60,966 | 149,800 | |
--Owner-Occupied | 1,877 | 31,479 | 79,599 | |
--Renter-Occupied | 2,246 | 25,991 | 60,581 | |
Owner-Occupied Values | < 100K | 18 | 329 | 982 |
100-199K | 38 | 1086 | 2190 | |
200-299K | 277 | 3491 | 6872 | |
300-399K | 514 | 6533 | 13126 | |
400-499K | 488 | 6593 | 12952 | |
500K+ | 542 | 13448 | 43477 | |
Total Working Age Population | 7,455 | 118,721 | 284,267 | |
In Work Force | 5,113 | 84,978 | 200,467 | |
Not In Work Force | 2,342 | 33,743 | 83,801 | |
Workforce Employed | 4,797 | 80,136 | 190,493 | |
Workforce Unemployed | 315 | 4,725 | 9,636 | |
Civlian Workforce | 5,112 | 84,861 | 200,130 | |
Military Workforce | 1 | 117 | 337 | |
Total Households | 4,124 | 57,471 | 140,180 | |
Family Households | 1,885 | 33,691 | 80,615 | |
Non-Family Households | 2,238 | 23,780 | 59,565 | |
Married Couple | 1,232 | 22,818 | 58,426 | |
Other Family | 653 | 10,873 | 22,188 | |
Married w/Child | 559 | 9,236 | 23,160 | |
Single Male w/Child | 74 | 1,355 | 3,029 | |
Single Female w/Child | 285 | 3,810 | 7,138 |
Population Change Last Two Decades - Plus Projection
2000 | % | 2010 | % | 2020 | % | 2030 | |
---|---|---|---|---|---|---|---|
Washington | 5,894,121 | +14 | 6,724,540 | +14 | 7,638,415 | +11 | 8,503,178 |
King County | 1,737,034 | +11 | 1,931,249 | +16 | 2,231,408 | +11 | 2,474,625 |
Kitsap County | 231,969 | +8 | 251,133 | +10 | 275,910 | +10 | 303,528 |
Total Working Age Population:
Total Households:
Total Working Age Population:
Total Households:
Total Working Age Population:
Total Households: