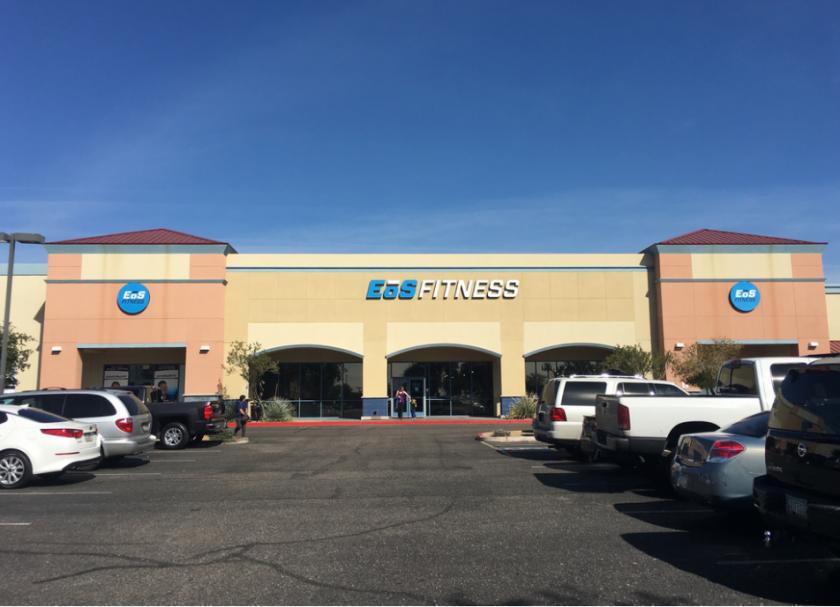
Retail Space
8360 West Thunderbird Road Peoria, AZ 85381
8360 West Thunderbird Road Peoria, AZ 85381
Details & Description
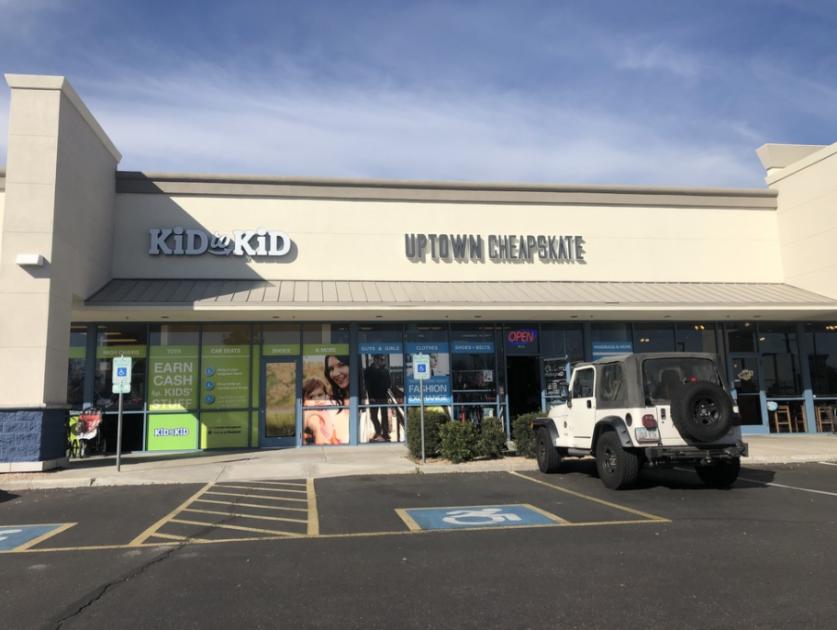
Additional Photos


Listing Agents

Gabe Ortega
O: 602-852-3415
M: 480-213-0861
gabe.ortega@naihorizon.com
O: 602-852-3415
M: 480-213-0861
gabe.ortega@naihorizon.com

Chris Gerow
O: 602-852-3413
M: 602-369-6963
chris.gerow@naihorizon.com
O: 602-852-3413
M: 602-369-6963
chris.gerow@naihorizon.com

Shelby Tworek
O: 602-667-1797
M: 602-741-4122
shelby.tworek@naihorizon.com
O: 602-667-1797
M: 602-741-4122
shelby.tworek@naihorizon.com
While we strive to provide the most accurate information, all listing information, and demographic data, is provided by third-parties. As such, MyEListing will not be responsible for the accuracy of the information. It is strongly recommended that you verify all information with the listing agent, and any relevant agencies, prior to making any decisions.


