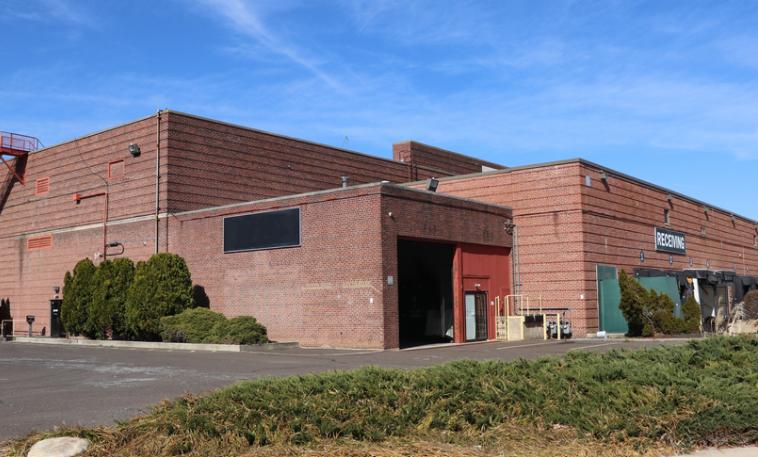
Located within the Bristol Commerce Center, 2201 Green Lane is a 361,151+/- SF industrial complex on 26+/- acres, Excellent location with easy access to the PA Turnpike, NJ Turnpike and I-95.
Highlights:
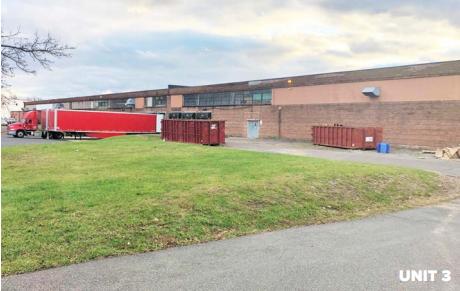
Up to 212,088 SF contiguous industrial space available for lease
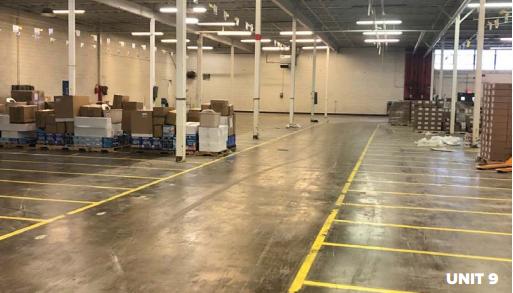
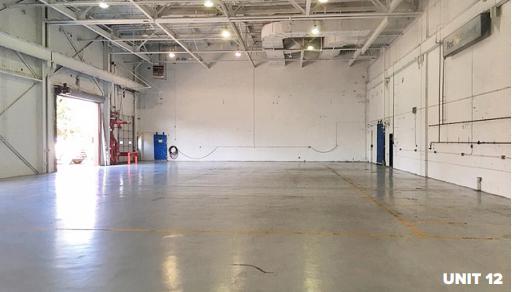
Individual units range from 13,111 SF to 116,000 SF
Unit 9 has 60,000 SF of racking in place (690 bays)
4,025 SF free-standing office building available for lease in conjunction with or separately from the industrial space
Ceiling heights range from 16' - 26'
Up to 20 loading docks and 6 drive-in doors available
Most warehouse units are clear-span
No part of this information may be copied, reproduced, repurposed, or screen-captured for any commercial purpose without prior written authorization from MyEListing.
While we strive to provide the most accurate information, all listing information, and demographic data, is provided by third-parties. As such, MyEListing will not be responsible for the accuracy of the information. It is strongly recommended that you verify all information with the listing agent, and any relevant agencies, prior to making any decisions.
What is the asking price for 2201 Green Lane in Levittown?
The asking price for 2201 Green Lane is $7.00 a SF per Year
What is the building size of this commercial Flex/Office Whs property?
The size of this lease property at '.2201 Green Lane.' is 4025 square feet
What is the population within 1 mile of 2201 Green Lane in Levittown?
The population within 1 mile of 2201 Green Lane Levittown, PA 19057 is 7,594 people.
Who do I contact for questions about 2201 Green Lane?
You should contact the listing agent,
Adam Lashner, for any details regarding this commercial listing.