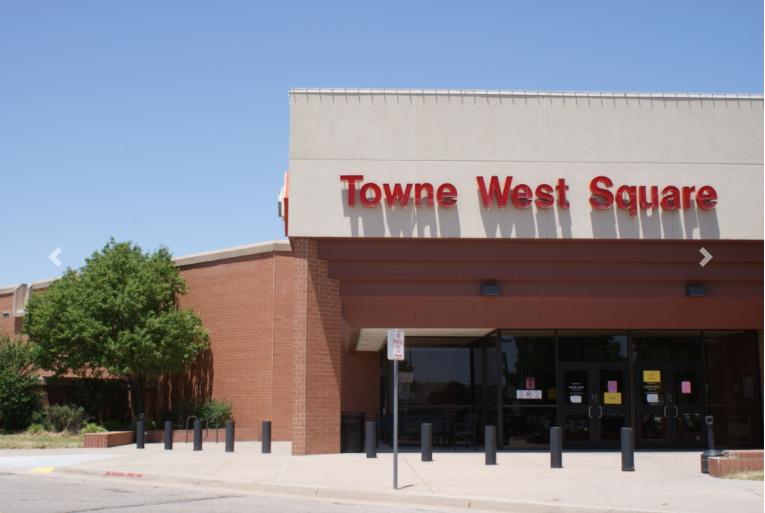
Retail Space
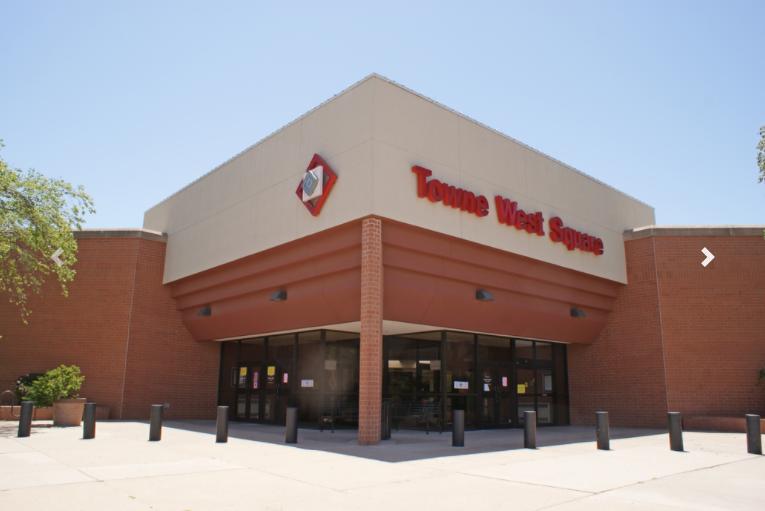
4600 West Kellogg Drive Wichita, KS 67209
4600 West Kellogg Drive Wichita, KS 67209
Details & Description
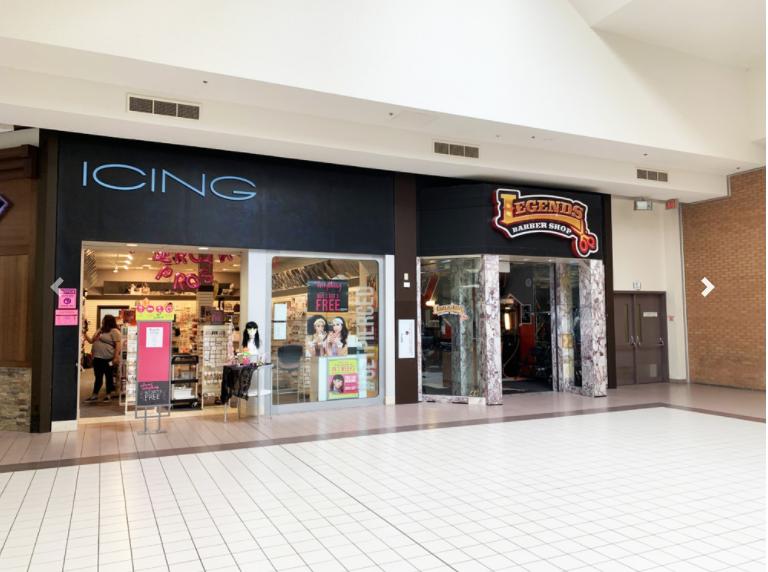
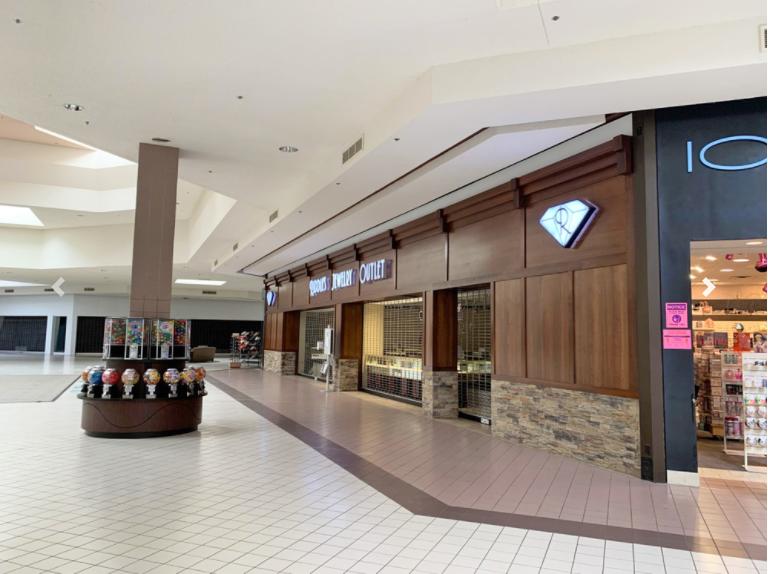
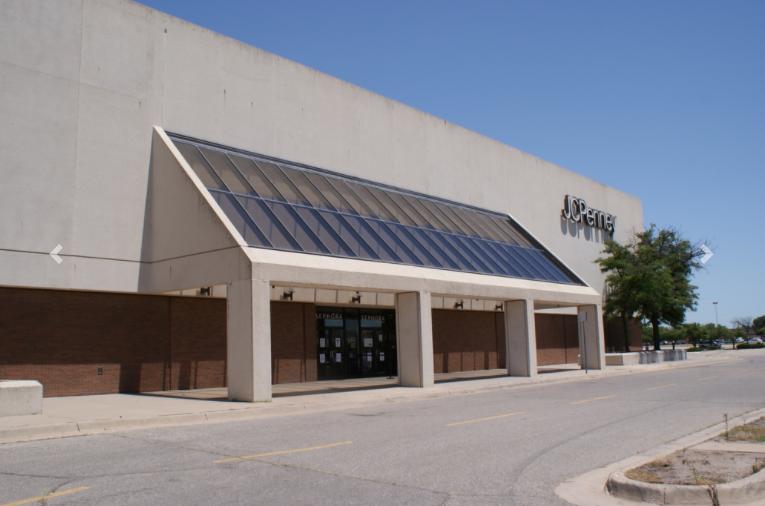
Additional Photos
Listing Agents

Miles Osborne
O: 316-928-8613
M: 316-652-5186
mosborne@naimartens.com
O: 316-928-8613
M: 316-652-5186
mosborne@naimartens.com

Drew Gannon
O: 316-847-4918
dgannon@naimartens.com
O: 316-847-4918
dgannon@naimartens.com
While we strive to provide the most accurate information, all listing information, and demographic data, is provided by third-parties. As such, MyEListing will not be responsible for the accuracy of the information. It is strongly recommended that you verify all information with the listing agent, and any relevant agencies, prior to making any decisions.


