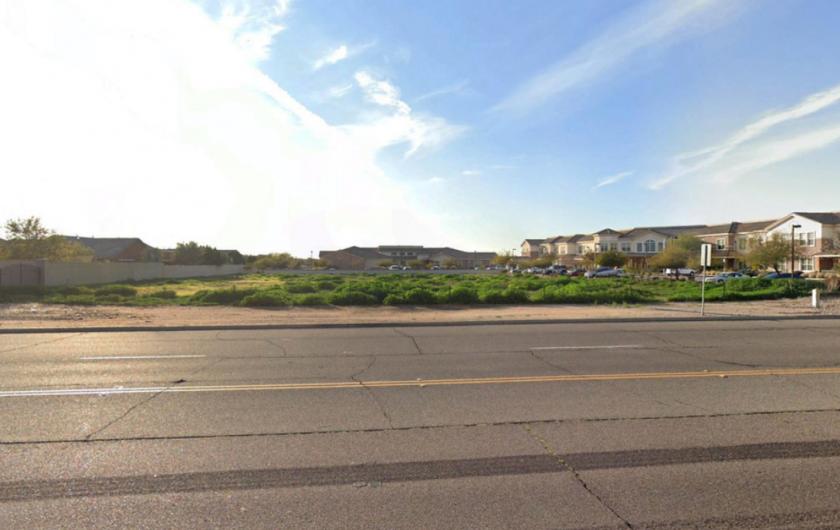
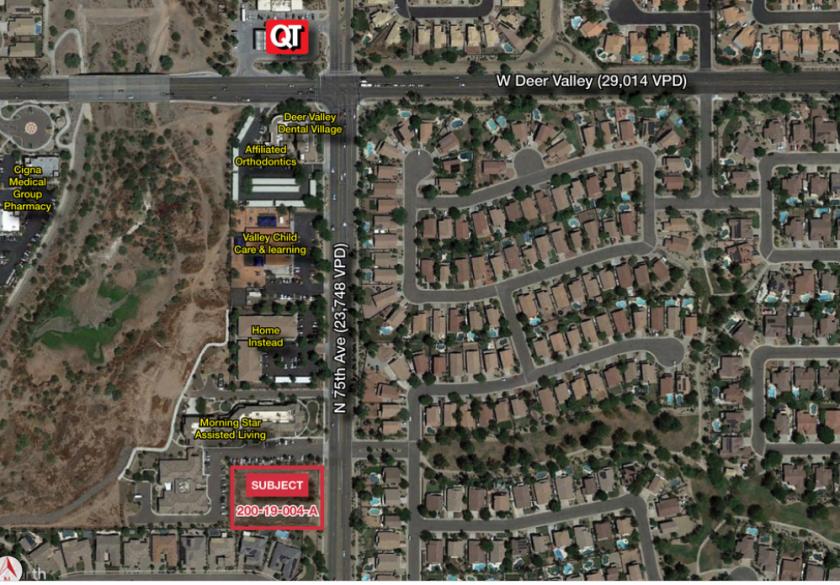
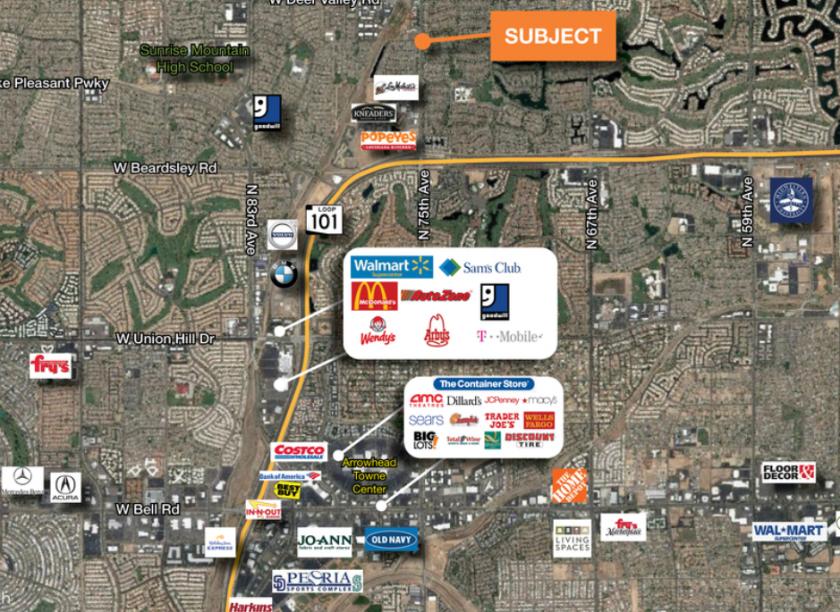
1-Mile | 3-Miles | 5-Miles | ||
---|---|---|---|---|
Total Population | 14,430 | 86,468 | 220,990 | |
Population Median Age | 37 | 40 | 42 | |
Population by Age | 0-9 Yrs | 1696 (11%) | 9937 (11%) | 23800 (10%) |
10-19 Yrs | 2391 (16%) | 11732 (13%) | 28312 (12%) | |
20-29 Yrs | 1636 (11%) | 10176 (11%) | 24564 (11%) | |
30-39 Yrs | 1941 (13%) | 9422 (10%) | 24639 (11%) | |
40-49 Yrs | 2119 (14%) | 12028 (13%) | 28448 (12%) | |
50-59 Yrs | 2226 (15%) | 12972 (15%) | 31744 (14%) | |
60-69 Yrs | 1599 (11%) | 11018 (12%) | 28478 (12%) | |
70+ Yrs | 823 (5%) | 9184 (10%) | 31005 (14%) | |
Median HH Income | $104,610 | $90,777 | $80,545 | |
Total Household Income | < 24K | 254 (5%) | 3336 (10%) | 9978 (12%) |
25-49K | 447 (9%) | 4121 (13%) | 14017 (17%) | |
50-74K | 870 (18%) | 5177 (16%) | 14108 (17%) | |
75-99K | 687 (14%) | 4701 (15%) | 12536 (15%) | |
100-199K | 1997 (41%) | 10472 (33%) | 24088 (29%) | |
200K+ | 569 (11%) | 3396 (10%) | 7040 (8%) | |
Highest Education Level | No Diploma | 378 | 2842 | 8684 |
Diploma or GED | 1952 | 11964 | 35944 | |
Some College | 1987 | 13876 | 41139 | |
Assoc. Degree | 1216 | 6420 | 15754 | |
Bachelors Degree | 2492 | 15662 | 35760 | |
Higher Degree | 1456 | 9190 | 20062 | |
Total Housing Units | 5,115 | 34,189 | 89,992 | |
--Owner-Occupied | 3,572 | 23,723 | 63,450 | |
--Renter-Occupied | 1,252 | 7,481 | 18,316 | |
Owner-Occupied Values | < 100K | 68 | 420 | 2695 |
100-199K | 185 | 1833 | 12110 | |
200-299K | 1196 | 7753 | 21752 | |
300-399K | 1482 | 7288 | 14340 | |
400-499K | 462 | 3449 | 6905 | |
500K+ | 179 | 2980 | 5649 | |
Total Working Age Population | 11,320 | 69,388 | 180,274 | |
In Work Force | 8,044 | 45,090 | 110,934 | |
Not In Work Force | 3,276 | 24,299 | 69,340 | |
Workforce Employed | 7,578 | 43,233 | 105,969 | |
Workforce Unemployed | 398 | 1,711 | 4,666 | |
Civlian Workforce | 7,976 | 44,945 | 110,635 | |
Military Workforce | 68 | 145 | 299 | |
Total Households | 4,824 | 31,204 | 81,766 | |
Family Households | 3,883 | 22,569 | 57,773 | |
Non-Family Households | 941 | 8,635 | 23,993 | |
Married Couple | 3,219 | 18,769 | 46,660 | |
Other Family | 664 | 3,800 | 11,114 | |
Married w/Child | 1,503 | 7,057 | 16,525 | |
Single Male w/Child | 108 | 875 | 2,158 | |
Single Female w/Child | 254 | 1,060 | 2,936 |
Population Change Last Two Decades - Plus Projection
2000 | % | 2010 | % | 2020 | % | 2030 | |
---|---|---|---|---|---|---|---|
Arizona | 5,130,632 | +25 | 6,392,017 | +14 | 7,286,100 | +14 | 8,284,900 |
Maricopa County | 3,072,149 | +24 | 3,817,117 | +16 | 4,436,900 | +15 | 5,107,700 |
Total Working Age Population:
Total Households:
Total Working Age Population:
Total Households:
Total Working Age Population:
Total Households: