Industrial Properties
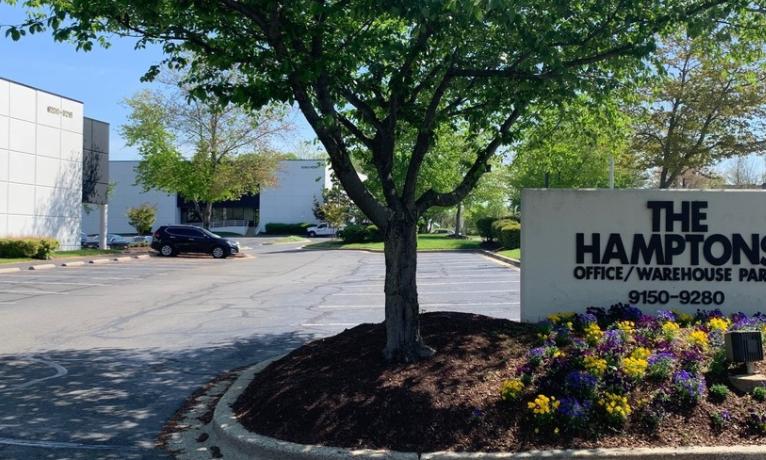
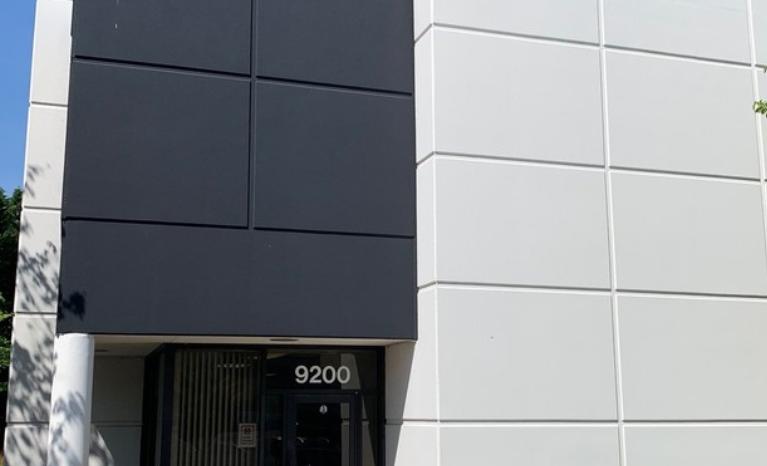
9200 Hampton Overlook Capitol Heights, MD 20743
9200 Hampton Overlook Capitol Heights, MD 20743
Details & Description
Listing Agents

Peter Burleigh
O: 301-918-2913
pburleigh@naimichael.com
O: 301-918-2913
pburleigh@naimichael.com
While we strive to provide the most accurate information, all listing information, and demographic data, is provided by third-parties. As such, MyEListing will not be responsible for the accuracy of the information. It is strongly recommended that you verify all information with the listing agent, and any relevant agencies, prior to making any decisions.