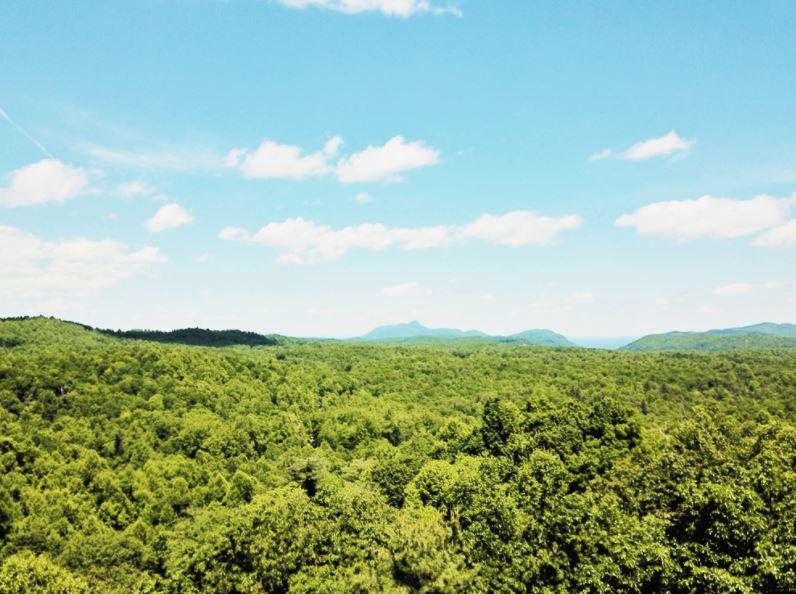
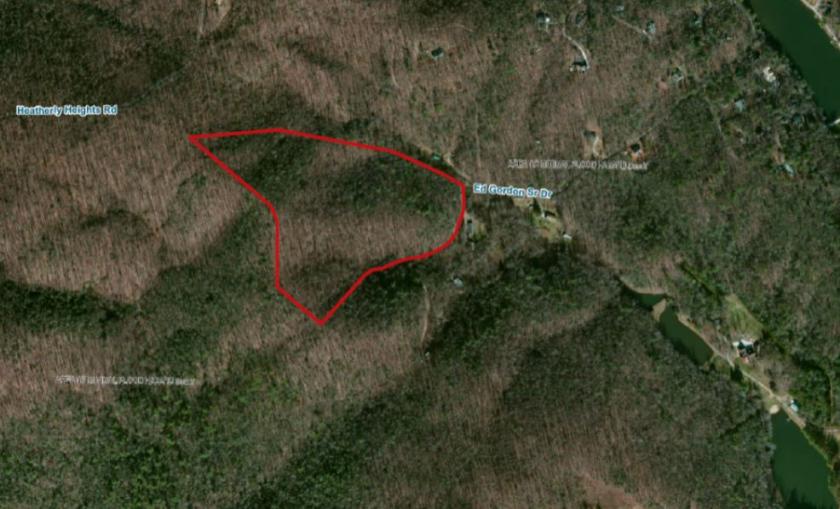
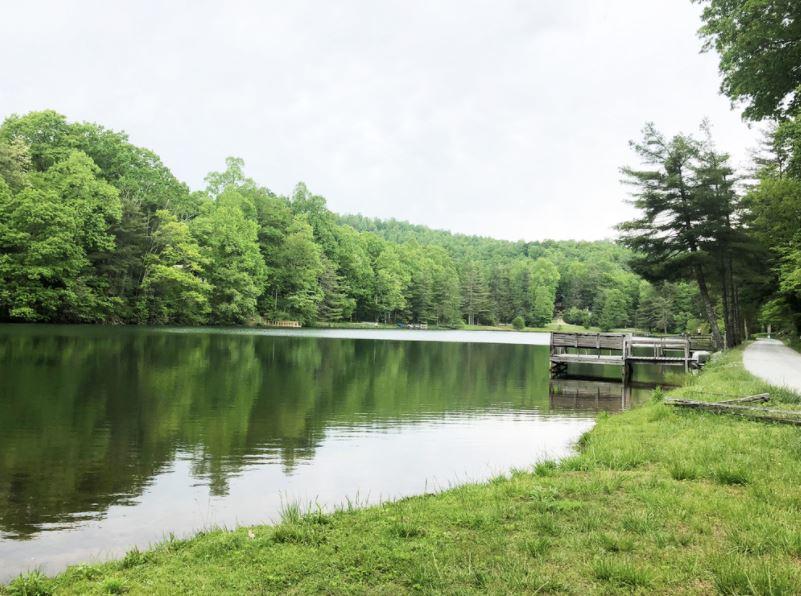
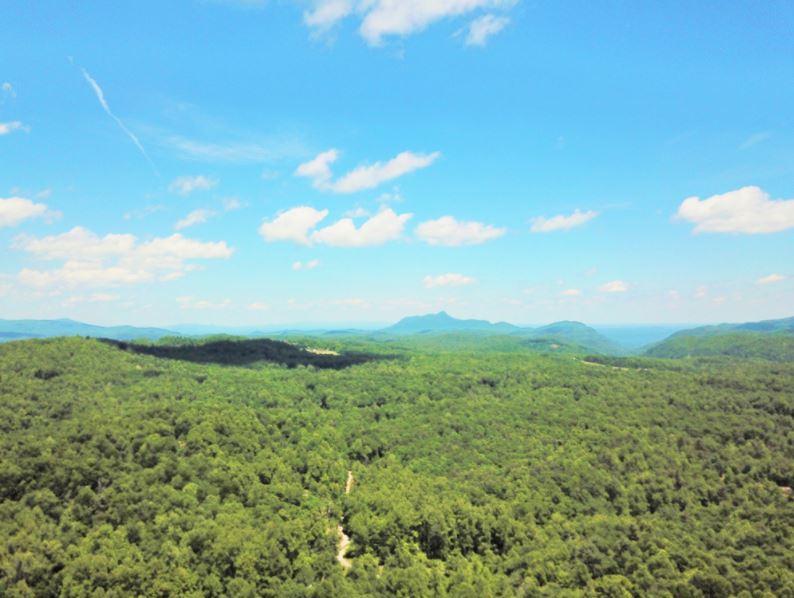
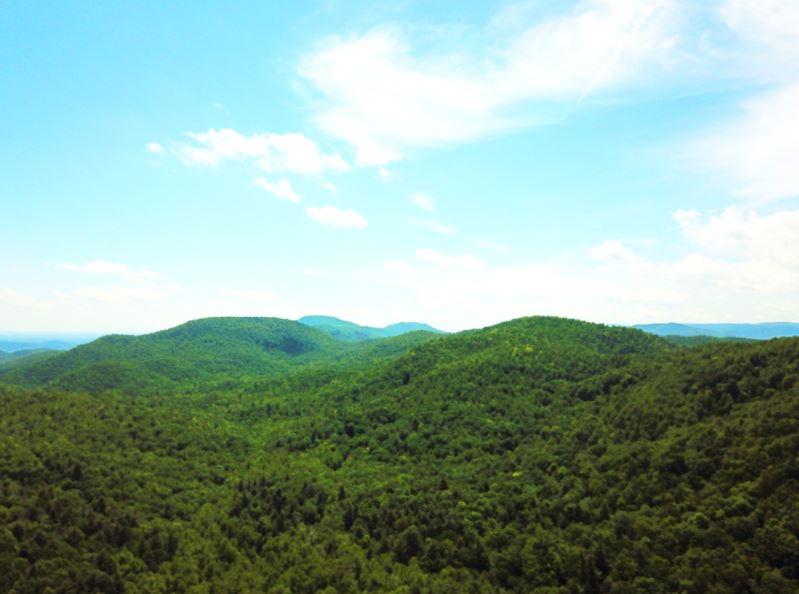
Ultimate privacy. Imagine out your back door you have 19,000 acres of buffer between you and your neighbors. This 21 Acre mountain retreat boarders the Greenville County watershed. A pristine landscape of mountains, hills, rivers, waterfalls, & streams protected by conservation easement.The property peak sits at roughly 2,000 feet above sea level exceeding the height of Paris Mountain and rivaling heights on Stone Mountain. The trek up is an adventurous one but ready and waiting for an owner with vision to build their secluded mountain escape. A hikers dream to walk outside and jump on the 500 mile Palmetto trail. The property is situated on mile 4.5 of the Saluda Mountain Passage.Saluda Mountains Passage runs along the ridge defining the northern perimeter of the Poinsett Watershed and the border between the Carolinas. The 19,000-Acre watershed is a pristine wilderness area with remarkable habitat for rare plants and animals, including the threatened Peregrine falcon. Greenville Water System (Gw) owns the tract, which drains the headwaters of the North Saluda River into Poinsett Reservoir. The Nature Conservancy holds the conservation easement. GW permits hiking, but enforces strict rules in exchange for access. Please help Palmetto Conservation keep this passage open by following the rules. Note that many organisms in the streams have low tolerance for pollution. Practicing “Leave No Trace” is essential in this extraordinary ecosystem. The passage trailhead connects with Poinsett Reservoir Passage at Orchard Lake Campground.