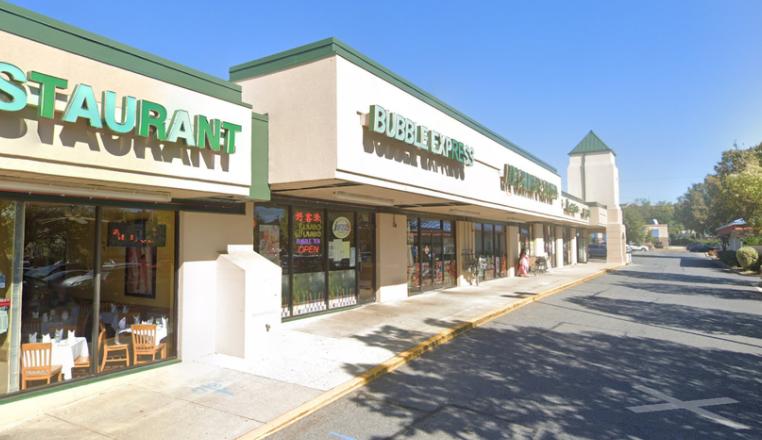
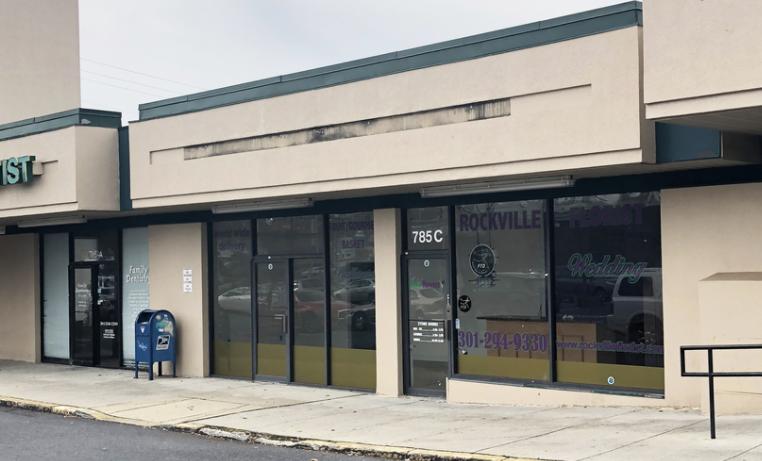
1-Mile | 3-Miles | 5-Miles | ||
---|---|---|---|---|
Total Population | 17,265 | 118,438 | 321,427 | |
Population Median Age | 38 | 40 | 40 | |
Population by Age | 0-9 Yrs | 2328 (13%) | 14151 (11%) | 38164 (11%) |
10-19 Yrs | 1648 (9%) | 14741 (12%) | 38194 (11%) | |
20-29 Yrs | 2375 (13%) | 13148 (11%) | 36458 (11%) | |
30-39 Yrs | 3096 (17%) | 16366 (13%) | 43830 (13%) | |
40-49 Yrs | 2244 (12%) | 16447 (13%) | 44439 (13%) | |
50-59 Yrs | 2180 (12%) | 16510 (13%) | 43811 (13%) | |
60-69 Yrs | 1905 (11%) | 13001 (10%) | 36432 (11%) | |
70+ Yrs | 1489 (8%) | 14074 (11%) | 40099 (12%) | |
Median HH Income | $90,595 | $111,002 | $106,545 | |
Total Household Income | < 24K | 779 (12%) | 4431 (10%) | 11345 (9%) |
25-49K | 912 (14%) | 4986 (11%) | 14784 (12%) | |
50-74K | 917 (14%) | 5601 (12%) | 15733 (13%) | |
75-99K | 955 (14%) | 4979 (11%) | 14506 (12%) | |
100-199K | 1837 (28%) | 13595 (31%) | 35646 (29%) | |
200K+ | 1007 (15%) | 10127 (23%) | 26856 (22%) | |
Highest Education Level | No Diploma | 1401 | 7120 | 21131 |
Diploma or GED | 1743 | 9270 | 29764 | |
Some College | 1725 | 10029 | 29289 | |
Assoc. Degree | 517 | 3710 | 11082 | |
Bachelors Degree | 2913 | 23184 | 60565 | |
Higher Degree | 3740 | 30124 | 75928 | |
Total Housing Units | 6,762 | 45,564 | 124,351 | |
--Owner-Occupied | 3,783 | 26,996 | 77,498 | |
--Renter-Occupied | 2,623 | 16,723 | 41,371 | |
Owner-Occupied Values | < 100K | 50 | 295 | 1592 |
100-199K | 128 | 653 | 4043 | |
200-299K | 361 | 1619 | 8668 | |
300-399K | 1108 | 4283 | 12751 | |
400-499K | 870 | 5068 | 11990 | |
500K+ | 1267 | 15077 | 38454 | |
Total Working Age Population | 13,984 | 95,108 | 259,416 | |
In Work Force | 10,245 | 65,589 | 179,994 | |
Not In Work Force | 3,739 | 29,519 | 79,422 | |
Workforce Employed | 9,630 | 62,019 | 170,845 | |
Workforce Unemployed | 524 | 2,992 | 7,823 | |
Civlian Workforce | 10,154 | 65,011 | 178,668 | |
Military Workforce | 91 | 578 | 1,326 | |
Total Households | 6,406 | 43,719 | 118,869 | |
Family Households | 4,001 | 29,194 | 79,817 | |
Non-Family Households | 2,405 | 14,525 | 39,052 | |
Married Couple | 2,885 | 23,606 | 63,227 | |
Other Family | 1,116 | 5,588 | 16,590 | |
Married w/Child | 1,292 | 11,015 | 27,893 | |
Single Male w/Child | 148 | 595 | 1,952 | |
Single Female w/Child | 372 | 1,957 | 5,668 |
Population Change Last Two Decades - Plus Projection
2000 | % | 2010 | % | 2020 | % | 2030 | |
---|---|---|---|---|---|---|---|
Maryland | 5,296,486 | +9 | 5,773,552 | +6 | 6,141,900 | +6 | 6,518,750 |
Howard County | 247,842 | +16 | 287,085 | +17 | 336,900 | +9 | 366,800 |
Montgomery County | 873,341 | +11 | 971,777 | +8 | 1,052,050 | +7 | 1,128,800 |
Prince Georges County | 801,515 | +8 | 863,420 | +6 | 916,150 | +4 | 952,950 |
Virginia | 7,078,515 | +13 | 8,001,024 | +8 | 8,655,021 | +8 | 9,331,666 |
Fairfax County | 969,749 | +12 | 1,081,726 | +7 | 1,162,504 | +7 | 1,244,025 |
Total Working Age Population:
Total Households:
Total Working Age Population:
Total Households:
Total Working Age Population:
Total Households: