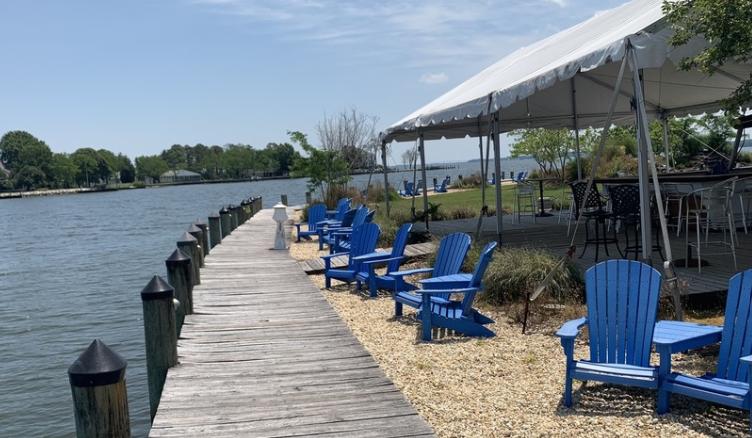
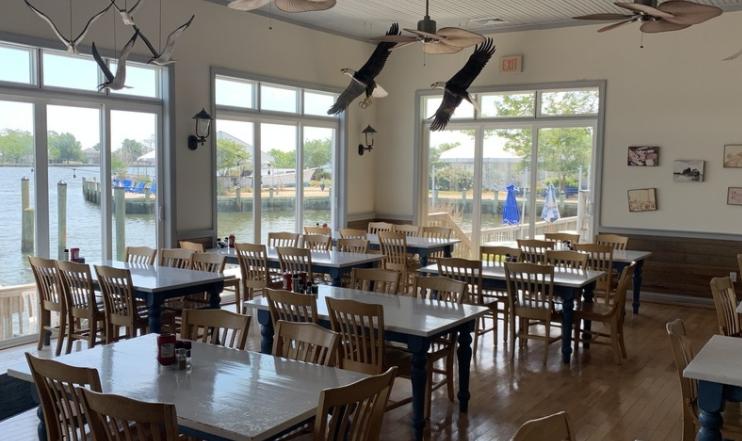
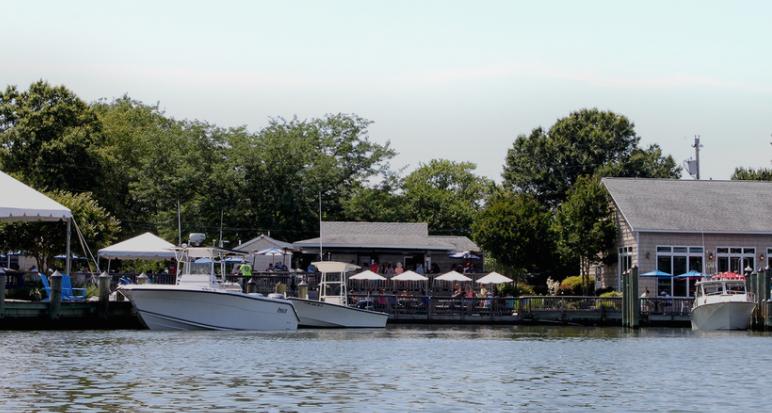
1-Mile | 3-Miles | 5-Miles | ||
---|---|---|---|---|
Total Population | 625 | 6,114 | 22,139 | |
Population Median Age | 41 | 41 | 41 | |
Population by Age | 0-9 Yrs | 68 (10%) | 618 (10%) | 2104 (9%) |
10-19 Yrs | 72 (11%) | 852 (13%) | 3213 (14%) | |
20-29 Yrs | 88 (14%) | 703 (11%) | 2585 (11%) | |
30-39 Yrs | 51 (8%) | 557 (9%) | 2405 (10%) | |
40-49 Yrs | 87 (13%) | 776 (12%) | 2916 (13%) | |
50-59 Yrs | 128 (20%) | 1185 (19%) | 4040 (18%) | |
60-69 Yrs | 63 (10%) | 723 (11%) | 2687 (12%) | |
70+ Yrs | 67 (10%) | 700 (11%) | 2190 (9%) | |
Median HH Income | $127,389 | $114,649 | $107,459 | |
Total Household Income | < 24K | 2 (0%) | 100 (4%) | 472 (5%) |
25-49K | 21 (10%) | 240 (11%) | 1002 (12%) | |
50-74K | 20 (9%) | 255 (11%) | 960 (12%) | |
75-99K | 18 (8%) | 292 (13%) | 1194 (15%) | |
100-199K | 108 (52%) | 893 (41%) | 3027 (38%) | |
200K+ | 38 (18%) | 385 (17%) | 1217 (15%) | |
Highest Education Level | No Diploma | 27 | 363 | 1174 |
Diploma or GED | 125 | 1115 | 4791 | |
Some College | 106 | 998 | 3842 | |
Assoc. Degree | 21 | 239 | 1038 | |
Bachelors Degree | 82 | 751 | 2529 | |
Higher Degree | 63 | 725 | 2153 | |
Total Housing Units | 228 | 2,408 | 8,837 | |
--Owner-Occupied | 194 | 1,892 | 6,787 | |
--Renter-Occupied | 12 | 273 | 1,084 | |
Owner-Occupied Values | < 100K | 2 | 43 | 204 |
100-199K | 9 | 133 | 643 | |
200-299K | 44 | 397 | 1947 | |
300-399K | 41 | 375 | 1494 | |
400-499K | 20 | 199 | 707 | |
500K+ | 77 | 744 | 1792 | |
Total Working Age Population | 523 | 5,084 | 18,156 | |
In Work Force | 361 | 3,313 | 12,140 | |
Not In Work Force | 162 | 1,771 | 6,016 | |
Workforce Employed | 359 | 3,222 | 11,687 | |
Workforce Unemployed | 2 | 69 | 357 | |
Civlian Workforce | 361 | 3,291 | 12,044 | |
Military Workforce | 0 | 22 | 95 | |
Total Households | 206 | 2,165 | 7,871 | |
Family Households | 154 | 1,661 | 5,911 | |
Non-Family Households | 52 | 504 | 1,960 | |
Married Couple | 121 | 1,368 | 4,858 | |
Other Family | 33 | 293 | 1,054 | |
Married w/Child | 30 | 403 | 1,706 | |
Single Male w/Child | 0 | 11 | 121 | |
Single Female w/Child | 2 | 44 | 254 |
Population Change Last Two Decades - Plus Projection
2000 | % | 2010 | % | 2020 | % | 2030 | |
---|---|---|---|---|---|---|---|
Maryland | 5,296,486 | +9 | 5,773,552 | +6 | 6,141,900 | +6 | 6,518,750 |
Calvert County | 74,563 | +19 | 88,737 | +7 | 94,600 | +5 | 99,200 |
St. Marys County | 86,211 | +22 | 105,151 | +14 | 120,150 | +17 | 140,750 |
Total Working Age Population:
Total Households:
Total Working Age Population:
Total Households:
Total Working Age Population:
Total Households: