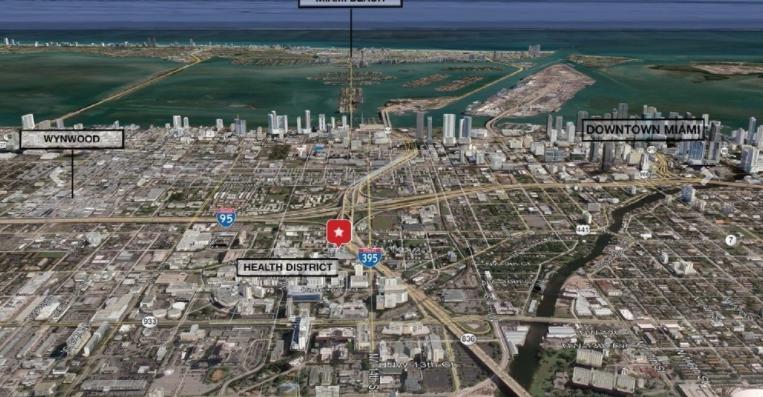
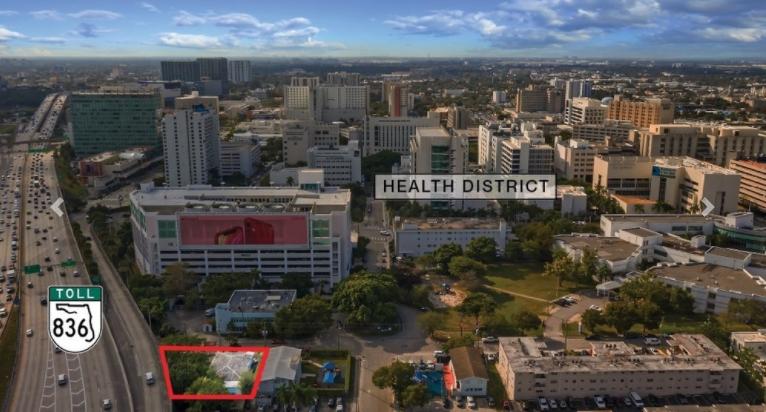
1-Mile | 3-Miles | 5-Miles | ||
---|---|---|---|---|
Total Population | 39,373 | 426,397 | 754,998 | |
Population Median Age | 40 | 40 | 41 | |
Population by Age | 0-9 Yrs | 4255 (10%) | 46509 (10%) | 83572 (11%) |
10-19 Yrs | 3727 (9%) | 33633 (7%) | 62488 (8%) | |
20-29 Yrs | 5978 (15%) | 58393 (13%) | 94648 (12%) | |
30-39 Yrs | 7032 (17%) | 86591 (20%) | 138450 (18%) | |
40-49 Yrs | 4809 (12%) | 64875 (15%) | 112819 (14%) | |
50-59 Yrs | 5127 (13%) | 53604 (12%) | 99659 (13%) | |
60-69 Yrs | 4020 (10%) | 41054 (9%) | 75487 (9%) | |
70+ Yrs | 4426 (11%) | 41738 (9%) | 87874 (11%) | |
Median HH Income | $24,620 | $50,912 | $50,972 | |
Total Household Income | < 24K | 7620 (50%) | 54465 (30%) | 92705 (29%) |
25-49K | 3794 (25%) | 34778 (19%) | 63043 (19%) | |
50-74K | 1657 (10%) | 25860 (14%) | 45301 (14%) | |
75-99K | 926 (6%) | 20094 (11%) | 32319 (10%) | |
100-199K | 857 (5%) | 27944 (15%) | 48993 (15%) | |
200K+ | 213 (1%) | 17568 (9%) | 33233 (10%) | |
Highest Education Level | No Diploma | 8909 | 58296 | 97273 |
Diploma or GED | 9073 | 73636 | 130697 | |
Some College | 4322 | 38758 | 71493 | |
Assoc. Degree | 1790 | 20951 | 41240 | |
Bachelors Degree | 3211 | 71103 | 127874 | |
Higher Degree | 1476 | 62755 | 104804 | |
Total Housing Units | 17,226 | 228,083 | 398,188 | |
--Owner-Occupied | 1,614 | 51,205 | 107,676 | |
--Renter-Occupied | 13,451 | 129,505 | 207,918 | |
Owner-Occupied Values | < 100K | 223 | 4550 | 8280 |
100-199K | 383 | 5695 | 12606 | |
200-299K | 484 | 12898 | 22506 | |
300-399K | 173 | 7285 | 14638 | |
400-499K | 64 | 5400 | 10490 | |
500K+ | 287 | 15377 | 39157 | |
Total Working Age Population | 32,775 | 358,198 | 630,932 | |
In Work Force | 18,506 | 235,889 | 410,305 | |
Not In Work Force | 14,269 | 122,308 | 220,626 | |
Workforce Employed | 16,949 | 222,616 | 387,697 | |
Workforce Unemployed | 1,557 | 13,103 | 22,190 | |
Civlian Workforce | 18,506 | 235,719 | 409,887 | |
Military Workforce | 0 | 170 | 418 | |
Total Households | 15,066 | 180,710 | 315,594 | |
Family Households | 7,468 | 89,985 | 162,140 | |
Non-Family Households | 7,598 | 90,725 | 153,455 | |
Married Couple | 3,808 | 57,004 | 103,752 | |
Other Family | 3,661 | 32,982 | 58,388 | |
Married w/Child | 1,406 | 21,371 | 37,955 | |
Single Male w/Child | 212 | 3,567 | 5,388 | |
Single Female w/Child | 1,429 | 10,390 | 19,709 |
Population Change Last Two Decades - Plus Projection
2000 | % | 2010 | % | 2020 | % | 2030 | |
---|---|---|---|---|---|---|---|
Florida | 15,982,378 | +18 | 18,801,310 | +14 | 21,517,610 | +13 | 24,340,457 |
Miami-Dade County | 2,253,362 | +11 | 2,496,435 | +15 | 2,861,579 | +11 | 3,190,242 |
Monroe County | 79,589 | -8 | 73,090 | +1 | 74,004 | 0 | 74,301 |
Total Working Age Population:
Total Households:
Total Working Age Population:
Total Households:
Total Working Age Population:
Total Households: