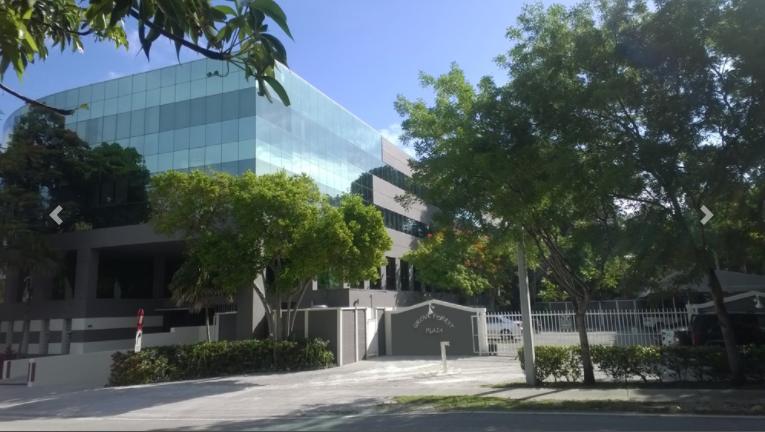
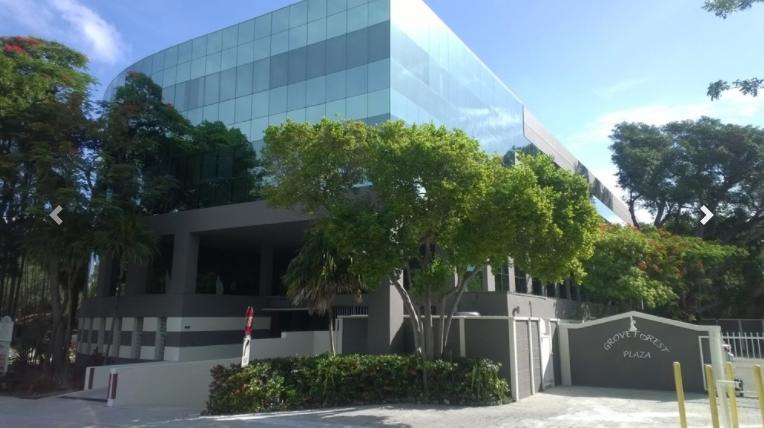
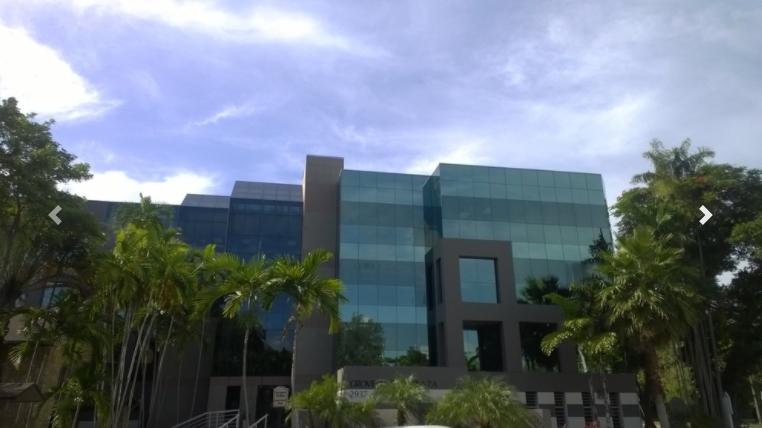
The Grove Forest Plaza is a four story 55,000 square foot modern glass exterior, boutique office building
Beautiful professional offices with spectacular tree top views
Ideal for all legal, accounting and financial professional firms
Recently renovated common areas, AC cooling towers, digital lobby directory and building security cameras
Location Features
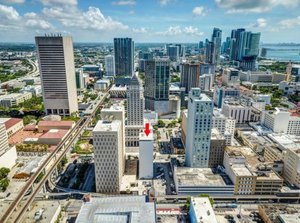
Walking distance to Coconut Grove Metrorail
Located on 27th Ave, just south of US-1
Convenient to restaurants, hotels and stores
Surrounded by lush landscaping overlooking the historic landmark “The Gifford House”
Property Features
24-hour tenant-controlled, landlord-maintained air-conditioning.
Secured covered reserved tenant and visitor parking
Professionally managed onsite building maintenance staff.
No part of this information may be copied, reproduced, repurposed, or screen-captured for any commercial purpose without prior written authorization from MyEListing.
While we strive to provide the most accurate information, all listing information, and demographic data, is provided by third-parties. As such, MyEListing will not be responsible for the accuracy of the information. It is strongly recommended that you verify all information with the listing agent, and any relevant agencies, prior to making any decisions.
What is the asking price for 2884 Southwest 27th Avenue in Miami?
The asking price for 2884 Southwest 27th Avenue is $28.00 a SF per Year
What is the building size of this commercial Office property?
The size of this multi-unit property varies between 1312 - 3356 square feet
What kind of Office is the propery at 2884 Southwest 27th Avenue?
The property at 2884 Southwest 27th Avenue Miami, FL 33133 is listed as a Professional Office property
What is the population within 1 mile of 2884 Southwest 27th Avenue in Miami?
The population within 1 mile of 2884 Southwest 27th Avenue Miami, FL 33133 is 33,296 people.
Who do I contact for questions about 2884 Southwest 27th Avenue?
You should contact the listing agent,
John Erixon, for any details regarding this commercial listing.