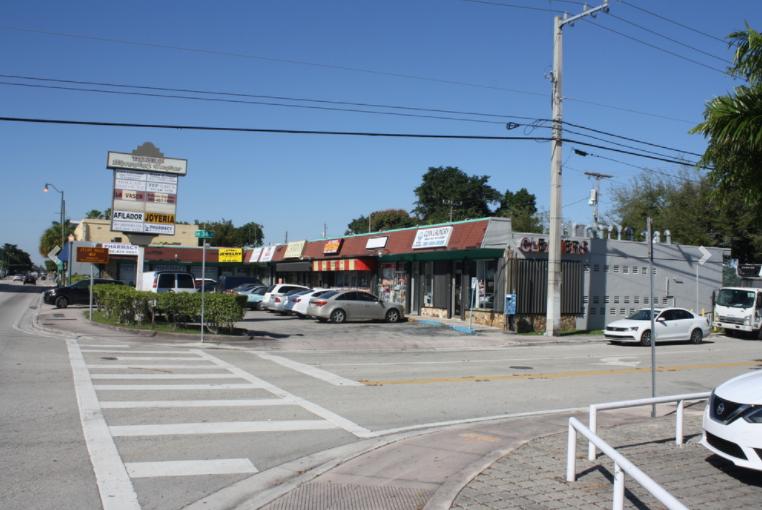
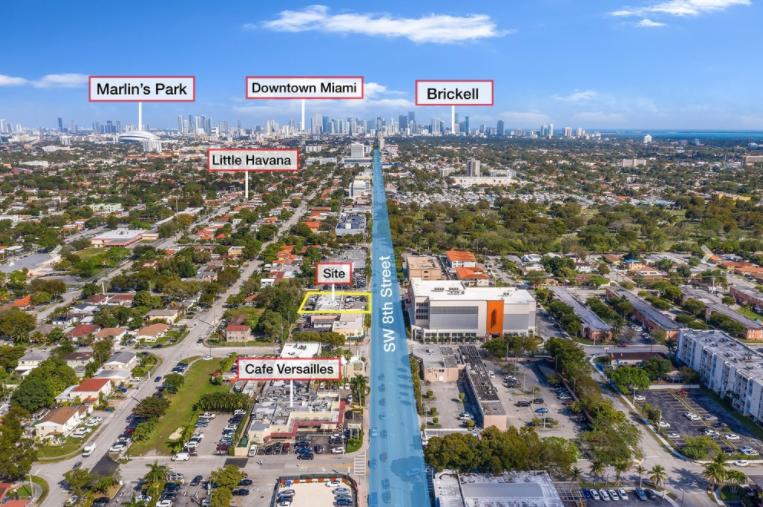
1-Mile | 3-Miles | 5-Miles | ||
---|---|---|---|---|
Total Population | 39,919 | 302,292 | 686,494 | |
Population Median Age | 44 | 43 | 41 | |
Population by Age | 0-9 Yrs | 3483 (8%) | 29853 (9%) | 72874 (10%) |
10-19 Yrs | 2834 (7%) | 26881 (8%) | 61632 (8%) | |
20-29 Yrs | 5225 (13%) | 36559 (12%) | 87401 (12%) | |
30-39 Yrs | 5259 (13%) | 43398 (14%) | 110949 (16%) | |
40-49 Yrs | 5920 (14%) | 43713 (14%) | 100602 (14%) | |
50-59 Yrs | 5887 (14%) | 42902 (14%) | 92709 (13%) | |
60-69 Yrs | 4820 (12%) | 32618 (10%) | 72784 (10%) | |
70+ Yrs | 6491 (16%) | 46368 (15%) | 87542 (12%) | |
Median HH Income | $40,433 | $38,721 | $50,108 | |
Total Household Income | < 24K | 5048 (32%) | 38800 (34%) | 78138 (29%) |
25-49K | 3813 (24%) | 27516 (24%) | 54937 (20%) | |
50-74K | 2717 (17%) | 15667 (14%) | 36746 (13%) | |
75-99K | 1601 (10%) | 9627 (8%) | 26349 (9%) | |
100-199K | 1762 (11%) | 13746 (12%) | 42929 (16%) | |
200K+ | 568 (3%) | 6547 (5%) | 27408 (10%) | |
Highest Education Level | No Diploma | 5845 | 50775 | 91847 |
Diploma or GED | 8863 | 68319 | 126478 | |
Some College | 4201 | 27531 | 62955 | |
Assoc. Degree | 2124 | 17561 | 36931 | |
Bachelors Degree | 6468 | 39779 | 109417 | |
Higher Degree | 3611 | 25675 | 88963 | |
Total Housing Units | 17,279 | 125,134 | 321,190 | |
--Owner-Occupied | 5,669 | 39,761 | 101,200 | |
--Renter-Occupied | 9,840 | 72,143 | 165,306 | |
Owner-Occupied Values | < 100K | 435 | 2182 | 6327 |
100-199K | 1074 | 5486 | 11717 | |
200-299K | 1577 | 8622 | 21799 | |
300-399K | 1374 | 7408 | 17269 | |
400-499K | 609 | 4454 | 9816 | |
500K+ | 599 | 11608 | 34272 | |
Total Working Age Population | 34,614 | 255,889 | 575,860 | |
In Work Force | 21,211 | 154,036 | 362,155 | |
Not In Work Force | 13,403 | 101,853 | 213,704 | |
Workforce Employed | 20,211 | 146,966 | 343,247 | |
Workforce Unemployed | 994 | 7,011 | 18,710 | |
Civlian Workforce | 21,205 | 153,977 | 361,956 | |
Military Workforce | 6 | 59 | 199 | |
Total Households | 15,509 | 111,904 | 266,506 | |
Family Households | 9,157 | 68,341 | 150,862 | |
Non-Family Households | 6,352 | 43,562 | 115,645 | |
Married Couple | 5,696 | 41,606 | 97,158 | |
Other Family | 3,461 | 26,735 | 53,704 | |
Married w/Child | 1,801 | 15,030 | 36,080 | |
Single Male w/Child | 182 | 2,250 | 5,010 | |
Single Female w/Child | 980 | 8,082 | 16,244 |
Population Change Last Two Decades - Plus Projection
2000 | % | 2010 | % | 2020 | % | 2030 | |
---|---|---|---|---|---|---|---|
Florida | 15,982,378 | +18 | 18,801,310 | +14 | 21,517,610 | +13 | 24,340,457 |
Miami-Dade County | 2,253,362 | +11 | 2,496,435 | +15 | 2,861,579 | +11 | 3,190,242 |
Monroe County | 79,589 | -8 | 73,090 | +1 | 74,004 | 0 | 74,301 |
Total Working Age Population:
Total Households:
Total Working Age Population:
Total Households:
Total Working Age Population:
Total Households: